Data
84,464 items of data are available, covering 79,909 participants.
Defined-instances run from 2 to 3, labelled using Instancing
2.
Units of measurement are AU.
| Maximum | 0.972697 |
| Decile 9 | 0.667269 |
| Decile 8 | 0.632764 |
| Decile 7 | 0.608007 |
| Decile 6 | 0.587365 |
| Median | 0.568576 |
| Decile 4 | 0.549991 |
| Decile 3 | 0.530643 |
| Decile 2 | 0.508711 |
| Decile 1 | 0.480192 |
| Minimum | 0.315992 |
|
|
- Mean = 0.571545
- Std.dev = 0.0729165
- 54 items above graph maximum of 0.854346
|
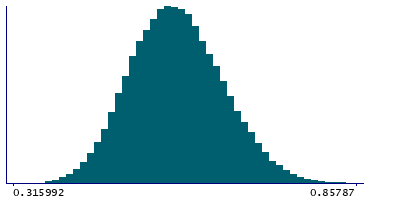
2 Instances
Instance 2 : Imaging visit (2014+)
79,706 participants, 79,706 items
| Maximum | 0.972697 |
| Decile 9 | 0.667663 |
| Decile 8 | 0.633055 |
| Decile 7 | 0.60814 |
| Decile 6 | 0.587405 |
| Median | 0.568565 |
| Decile 4 | 0.549953 |
| Decile 3 | 0.530631 |
| Decile 2 | 0.508659 |
| Decile 1 | 0.480126 |
| Minimum | 0.315992 |
|

|
- Mean = 0.571633
- Std.dev = 0.0731102
- 52 items above graph maximum of 0.8552
|
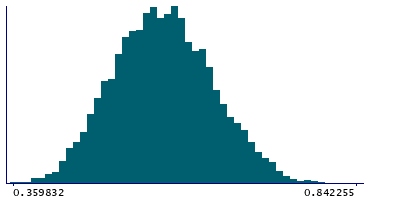
Instance 3 : First repeat imaging visit (2019+)
4,758 participants, 4,758 items
| Maximum | 0.94069 |
| Decile 9 | 0.661621 |
| Decile 8 | 0.629282 |
| Decile 7 | 0.606188 |
| Decile 6 | 0.586731 |
| Median | 0.568702 |
| Decile 4 | 0.550693 |
| Decile 3 | 0.530717 |
| Decile 2 | 0.509556 |
| Decile 1 | 0.480966 |
| Minimum | 0.359832 |
|
|
- Mean = 0.570061
- Std.dev = 0.0695751
- 3 items above graph maximum of 0.842276
|
Notes
Discrepancy between the (EPI-unwarped b=0) dMRI brain image (linearly-aligned to the T1) and the T1 brain image
0 Related Data-Fields
There are no related data-fields
2 Applications
| Application ID | Title |
|---|
| 17689 | Genetic, environmental and lifestyle predictors of brain/cognitive-related outcomes. |
| 22783 | The joint analysis of imaging data and genetic data for early tumor detection, prevention, diagnosis and treatment |


