Data
86,652 items of data are available, covering 82,007 participants.
Defined-instances run from 2 to 3, labelled using Instancing
2.
Units of measurement are mm3.
| Maximum | 8434.38 |
| Decile 9 | 4442.09 |
| Decile 8 | 4154.77 |
| Decile 7 | 3956.03 |
| Decile 6 | 3793.85 |
| Median | 3646.86 |
| Decile 4 | 3500.56 |
| Decile 3 | 3350.81 |
| Decile 2 | 3179.5 |
| Decile 1 | 2956.68 |
| Minimum | 1113.89 |
|

|
- Mean = 3678.17
- Std.dev = 584.937
- 71 items above graph maximum of 5927.5
|
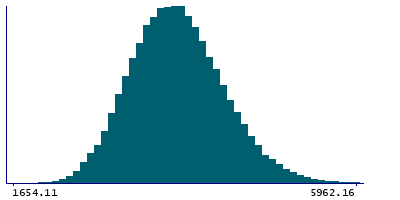
2 Instances
Instance 2 : Imaging visit (2014+)
81,871 participants, 81,871 items
| Maximum | 8434.38 |
| Decile 9 | 4439 |
| Decile 8 | 4150.97 |
| Decile 7 | 3952.66 |
| Decile 6 | 3789.79 |
| Median | 3643 |
| Decile 4 | 3496.55 |
| Decile 3 | 3346.53 |
| Decile 2 | 3175.79 |
| Decile 1 | 2951.85 |
| Minimum | 1113.89 |
|
|
- Mean = 3674.02
- Std.dev = 584.787
- 68 items above graph maximum of 5926.14
|
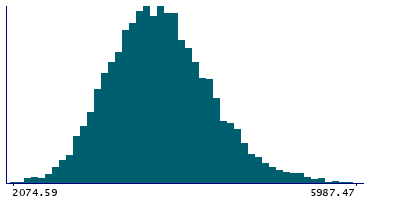
Instance 3 : First repeat imaging visit (2019+)
4,781 participants, 4,781 items
| Maximum | 6941.94 |
| Decile 9 | 4509.63 |
| Decile 8 | 4217.78 |
| Decile 7 | 4022.48 |
| Decile 6 | 3865.98 |
| Median | 3720.13 |
| Decile 4 | 3573.38 |
| Decile 3 | 3423.96 |
| Decile 2 | 3254.9 |
| Decile 1 | 3031.78 |
| Minimum | 2074.59 |
|
|
- Mean = 3749.26
- Std.dev = 582.931
- 3 items above graph maximum of 5987.47
|
Notes
Volume of grey matter in Left Central Opercular Cortex
0 Related Data-Fields
There are no related data-fields
0 Resources
There are no matching Resources
2 Applications
| Application ID | Title |
|---|
| 17689 | Genetic, environmental and lifestyle predictors of brain/cognitive-related outcomes. |
| 22783 | The joint analysis of imaging data and genetic data for early tumor detection, prevention, diagnosis and treatment |
