Data
86,652 items of data are available, covering 82,007 participants.
Defined-instances run from 2 to 3, labelled using Instancing
2.
Units of measurement are mm3.
| Maximum | 10393.7 |
| Decile 9 | 3038.23 |
| Decile 8 | 2900.33 |
| Decile 7 | 2807.88 |
| Decile 6 | 2731.06 |
| Median | 2661.55 |
| Decile 4 | 2592.08 |
| Decile 3 | 2519.28 |
| Decile 2 | 2437.06 |
| Decile 1 | 2325.09 |
| Minimum | 1270.11 |
|
|
- Mean = 2680.07
- Std.dev = 326.83
- 3 items below graph minimum of 1611.94
- 319 items above graph maximum of 3751.38
|
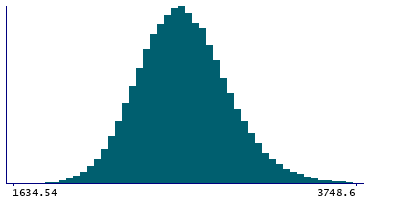
2 Instances
Instance 2 : Imaging visit (2014+)
81,871 participants, 81,871 items
| Maximum | 10393.7 |
| Decile 9 | 3037.09 |
| Decile 8 | 2899.26 |
| Decile 7 | 2806.65 |
| Decile 6 | 2729.69 |
| Median | 2660.2 |
| Decile 4 | 2590.6 |
| Decile 3 | 2517.89 |
| Decile 2 | 2435.45 |
| Decile 1 | 2323.5 |
| Minimum | 1270.11 |
|

|
- Mean = 2678.99
- Std.dev = 328.812
- 3 items below graph minimum of 1609.91
- 309 items above graph maximum of 3750.69
|
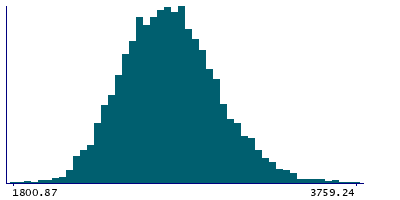
Instance 3 : First repeat imaging visit (2019+)
4,781 participants, 4,781 items
| Maximum | 8525.7 |
| Decile 9 | 3057.87 |
| Decile 8 | 2915.72 |
| Decile 7 | 2828.38 |
| Decile 6 | 2754.11 |
| Median | 2684.32 |
| Decile 4 | 2614.73 |
| Decile 3 | 2540.64 |
| Decile 2 | 2463.05 |
| Decile 1 | 2356.95 |
| Minimum | 1800.87 |
|
|
- Mean = 2698.61
- Std.dev = 290.176
- 10 items above graph maximum of 3758.78
|
Notes
Volume of grey matter in Left Thalamus
0 Related Data-Fields
There are no related data-fields
0 Resources
There are no matching Resources
2 Applications
| Application ID | Title |
|---|
| 17689 | Genetic, environmental and lifestyle predictors of brain/cognitive-related outcomes. |
| 22783 | The joint analysis of imaging data and genetic data for early tumor detection, prevention, diagnosis and treatment |
