Data
87,996 items of data are available, covering 83,313 participants.
Defined-instances run from 2 to 3, labelled using Instancing
2.
Units of measurement are AU.
| Maximum | 87.6279 |
| Decile 9 | 83.6248 |
| Decile 8 | 83.1505 |
| Decile 7 | 82.7892 |
| Decile 6 | 82.4728 |
| Median | 82.1647 |
| Decile 4 | 81.8152 |
| Decile 3 | 81.379 |
| Decile 2 | 80.8093 |
| Decile 1 | 80.0074 |
| Minimum | 58.8142 |
|

|
- Mean = 81.9563
- Std.dev = 1.4745
- 207 items below graph minimum of 76.39
- 3 items above graph maximum of 87.2422
|
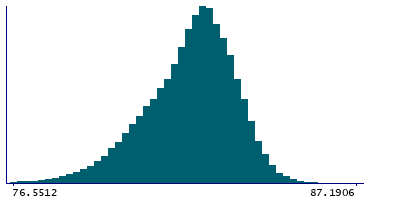
2 Instances
Instance 2 : Imaging visit (2014+)
83,241 participants, 83,241 items
| Maximum | 87.6279 |
| Decile 9 | 83.6223 |
| Decile 8 | 83.1469 |
| Decile 7 | 82.7846 |
| Decile 6 | 82.4679 |
| Median | 82.1577 |
| Decile 4 | 81.8058 |
| Decile 3 | 81.3696 |
| Decile 2 | 80.7966 |
| Decile 1 | 79.9978 |
| Minimum | 58.8681 |
|
|
- Mean = 81.9496
- Std.dev = 1.47523
- 199 items below graph minimum of 76.3733
- 3 items above graph maximum of 87.2469
|
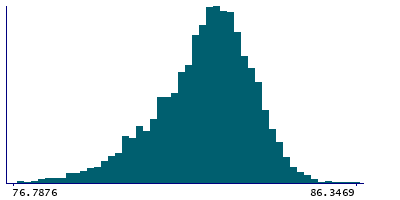
Instance 3 : First repeat imaging visit (2019+)
4,755 participants, 4,755 items
| Maximum | 86.3469 |
| Decile 9 | 83.6572 |
| Decile 8 | 83.2009 |
| Decile 7 | 82.8533 |
| Decile 6 | 82.5517 |
| Median | 82.2628 |
| Decile 4 | 81.9483 |
| Decile 3 | 81.5483 |
| Decile 2 | 81.0044 |
| Decile 1 | 80.2224 |
| Minimum | 58.8142 |
|
|
- Mean = 82.0739
- Std.dev = 1.45651
- 12 items below graph minimum of 76.7876
|
Notes
Mean intensity of Brain-Stem in the whole brain generated by subcortical volumetric segmentation (aseg)
0 Related Data-Fields
There are no related data-fields
0 Resources
There are no matching Resources
