Data
87,996 items of data are available, covering 83,313 participants.
Defined-instances run from 2 to 3, labelled using Instancing
2.
Units of measurement are mm3.
| Maximum | 1795.2 |
| Decile 9 | 668.6 |
| Decile 8 | 616 |
| Decile 7 | 579.8 |
| Decile 6 | 550.8 |
| Median | 523.5 |
| Decile 4 | 497.1 |
| Decile 3 | 469.7 |
| Decile 2 | 438.4 |
| Decile 1 | 397.7 |
| Minimum | 88.2 |
|
|
- Mean = 531.025
- Std.dev = 111.008
- 345 items above graph maximum of 939.5
|
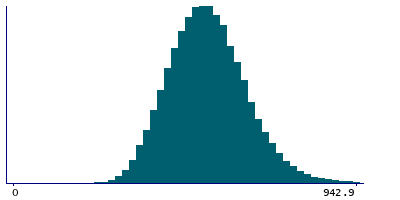
2 Instances
Instance 2 : Imaging visit (2014+)
83,241 participants, 83,241 items
| Maximum | 1795.2 |
| Decile 9 | 668.3 |
| Decile 8 | 615.6 |
| Decile 7 | 579.5 |
| Decile 6 | 550.4 |
| Median | 523.1 |
| Decile 4 | 496.6 |
| Decile 3 | 469.2 |
| Decile 2 | 438.1 |
| Decile 1 | 397.1 |
| Minimum | 88.2 |
|

|
- Mean = 530.64
- Std.dev = 111.13
- 333 items above graph maximum of 939.5
|
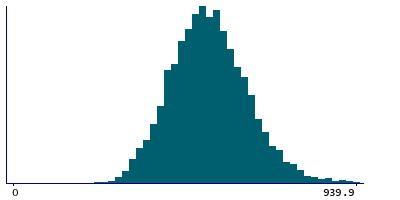
Instance 3 : First repeat imaging visit (2019+)
4,755 participants, 4,755 items
| Maximum | 1206.4 |
| Decile 9 | 673.2 |
| Decile 8 | 623.7 |
| Decile 7 | 587.9 |
| Decile 6 | 558.3 |
| Median | 531.55 |
| Decile 4 | 505.7 |
| Decile 3 | 477.95 |
| Decile 2 | 447.2 |
| Decile 1 | 406.5 |
| Minimum | 216.2 |
|
|
- Mean = 537.779
- Std.dev = 108.633
- 12 items above graph maximum of 939.9
|
Notes
Volume of CC-Mid-Posterior in the whole brain generated by subcortical volumetric segmentation (aseg)
0 Related Data-Fields
There are no related data-fields
0 Resources
There are no matching Resources
