Data
87,996 items of data are available, covering 83,313 participants.
Defined-instances run from 2 to 3, labelled using Instancing
2.
Units of measurement are mm3.
| Maximum | 1689 |
| Decile 9 | 672.5 |
| Decile 8 | 594 |
| Decile 7 | 548.5 |
| Decile 6 | 516.2 |
| Median | 489.1 |
| Decile 4 | 464.8 |
| Decile 3 | 440.9 |
| Decile 2 | 415.6 |
| Decile 1 | 383.4 |
| Minimum | 69 |
|
|
- Mean = 511.958
- Std.dev = 121.582
- 459 items above graph maximum of 961.6
|
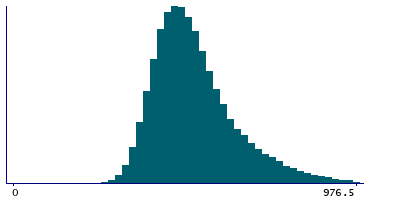
2 Instances
Instance 2 : Imaging visit (2014+)
83,241 participants, 83,241 items
| Maximum | 1689 |
| Decile 9 | 670.8 |
| Decile 8 | 592.8 |
| Decile 7 | 547.4 |
| Decile 6 | 515.2 |
| Median | 488.3 |
| Decile 4 | 464.1 |
| Decile 3 | 440.25 |
| Decile 2 | 415.1 |
| Decile 1 | 382.9 |
| Minimum | 69 |
|

|
- Mean = 511.074
- Std.dev = 121.274
- 449 items above graph maximum of 958.7
|
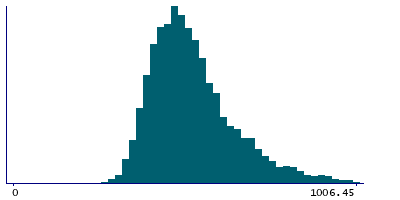
Instance 3 : First repeat imaging visit (2019+)
4,755 participants, 4,755 items
| Maximum | 1223.2 |
| Decile 9 | 699.1 |
| Decile 8 | 614.6 |
| Decile 7 | 566.35 |
| Decile 6 | 532.8 |
| Median | 503.7 |
| Decile 4 | 477.8 |
| Decile 3 | 452.5 |
| Decile 2 | 423.8 |
| Decile 1 | 392.15 |
| Minimum | 221.6 |
|
|
- Mean = 527.431
- Std.dev = 125.848
- 17 items above graph maximum of 1006.05
|
Notes
Volume of CC-Mid-Anterior in the whole brain generated by subcortical volumetric segmentation (aseg)
0 Related Data-Fields
There are no related data-fields
0 Resources
There are no matching Resources
