Data
87,996 items of data are available, covering 83,313 participants.
Defined-instances run from 2 to 3, labelled using Instancing
2.
Units of measurement are ratio.
| Maximum | 2.42588 |
| Decile 9 | 1.07173 |
| Decile 8 | 1.057 |
| Decile 7 | 1.04708 |
| Decile 6 | 1.03896 |
| Median | 1.03175 |
| Decile 4 | 1.0248 |
| Decile 3 | 1.01782 |
| Decile 2 | 1.00978 |
| Decile 1 | 0.998725 |
| Minimum | 0.275478 |
|
|
- Mean = 1.0339
- Std.dev = 0.0320104
- 41 items below graph minimum of 0.925723
- 147 items above graph maximum of 1.14473
|
2 Instances
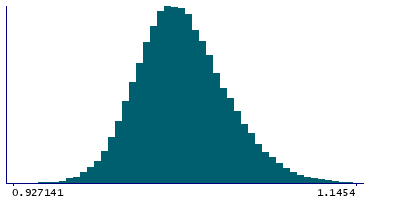
Instance 2 : Imaging visit (2014+)
83,241 participants, 83,241 items
| Maximum | 2.42588 |
| Decile 9 | 1.07168 |
| Decile 8 | 1.05693 |
| Decile 7 | 1.04704 |
| Decile 6 | 1.03894 |
| Median | 1.03174 |
| Decile 4 | 1.02476 |
| Decile 3 | 1.01779 |
| Decile 2 | 1.00977 |
| Decile 1 | 0.998723 |
| Minimum | 0.275478 |
|

|
- Mean = 1.03388
- Std.dev = 0.032131
- 39 items below graph minimum of 0.925766
- 140 items above graph maximum of 1.14464
|
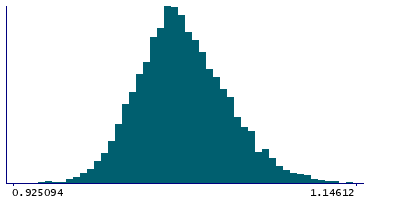
Instance 3 : First repeat imaging visit (2019+)
4,755 participants, 4,755 items
| Maximum | 1.20404 |
| Decile 9 | 1.07244 |
| Decile 8 | 1.05814 |
| Decile 7 | 1.04768 |
| Decile 6 | 1.03953 |
| Median | 1.03207 |
| Decile 4 | 1.02553 |
| Decile 3 | 1.01852 |
| Decile 2 | 1.01009 |
| Decile 1 | 0.998768 |
| Minimum | 0.60962 |
|
|
- Mean = 1.03425
- Std.dev = 0.0298182
- 2 items below graph minimum of 0.925094
- 7 items above graph maximum of 1.14612
|
Notes
Volume-ratio of MaskVol-to-eTIV in the whole brain generated by subcortical volumetric segmentation (aseg)
0 Related Data-Fields
There are no related data-fields
0 Resources
There are no matching Resources
