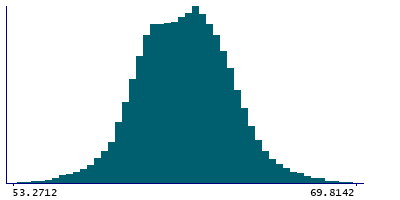
Data
87,996 items of data are available, covering 83,313 participants.
Defined-instances run from 2 to 3, labelled using Instancing
2.
Units of measurement are AU.
| Maximum | 74.2002 |
| Decile 9 | 64.3073 |
| Decile 8 | 63.3611 |
| Decile 7 | 62.6876 |
| Decile 6 | 62.0886 |
| Median | 61.5053 |
| Decile 4 | 60.8867 |
| Decile 3 | 60.2523 |
| Decile 2 | 59.6158 |
| Decile 1 | 58.7605 |
| Minimum | 48.1523 |
|
|
- Mean = 61.5089
- Std.dev = 2.26481
- 43 items below graph minimum of 53.2137
- 78 items above graph maximum of 69.8541
|
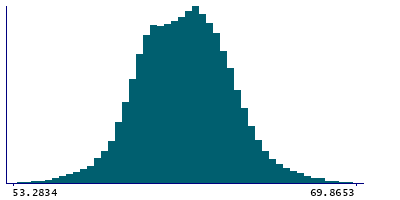
2 Instances
Instance 2 : Imaging visit (2014+)
83,241 participants, 83,241 items
| Maximum | 74.2002 |
| Decile 9 | 64.3368 |
| Decile 8 | 63.3891 |
| Decile 7 | 62.7146 |
| Decile 6 | 62.1159 |
| Median | 61.534 |
| Decile 4 | 60.9161 |
| Decile 3 | 60.2736 |
| Decile 2 | 59.6333 |
| Decile 1 | 58.7828 |
| Minimum | 48.1523 |
|
|
- Mean = 61.5349
- Std.dev = 2.2687
- 41 items below graph minimum of 53.2289
- 72 items above graph maximum of 69.8907
|
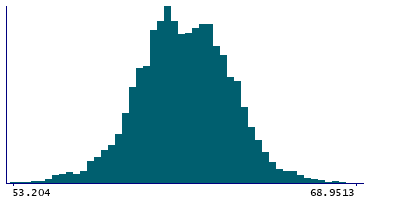
Instance 3 : First repeat imaging visit (2019+)
4,755 participants, 4,755 items
| Maximum | 72.0286 |
| Decile 9 | 63.7011 |
| Decile 8 | 62.8276 |
| Decile 7 | 62.1938 |
| Decile 6 | 61.6319 |
| Median | 61.026 |
| Decile 4 | 60.4518 |
| Decile 3 | 59.9246 |
| Decile 2 | 59.3129 |
| Decile 1 | 58.4597 |
| Minimum | 51.4333 |
|
|
- Mean = 61.054
- Std.dev = 2.14515
- 2 items below graph minimum of 53.2182
- 6 items above graph maximum of 68.9426
|
Notes
Mean intensity of Cerebellum-Cortex in the left hemisphere generated by subcortical volumetric segmentation (aseg)
0 Related Data-Fields
There are no related data-fields
0 Resources
There are no matching Resources
