Data
87,996 items of data are available, covering 83,313 participants.
Defined-instances run from 2 to 3, labelled using Instancing
2.
Units of measurement are AU.
| Maximum | 118.57 |
| Decile 9 | 101.681 |
| Decile 8 | 101.117 |
| Decile 7 | 100.706 |
| Decile 6 | 100.338 |
| Median | 99.9824 |
| Decile 4 | 99.6026 |
| Decile 3 | 99.1636 |
| Decile 2 | 98.5952 |
| Decile 1 | 97.6123 |
| Minimum | 72.8859 |
|
|
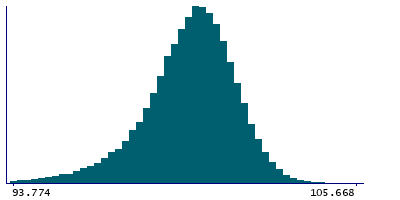
- Mean = 99.7517
- Std.dev = 1.82105
- 758 items below graph minimum of 93.5437
- 49 items above graph maximum of 105.75
|
2 Instances
Instance 2 : Imaging visit (2014+)
83,241 participants, 83,241 items
| Maximum | 118.57 |
| Decile 9 | 101.676 |
| Decile 8 | 101.112 |
| Decile 7 | 100.698 |
| Decile 6 | 100.332 |
| Median | 99.9731 |
| Decile 4 | 99.5938 |
| Decile 3 | 99.154 |
| Decile 2 | 98.5854 |
| Decile 1 | 97.5992 |
| Minimum | 72.8859 |
|

|
- Mean = 99.7427
- Std.dev = 1.82327
- 726 items below graph minimum of 93.5222
- 47 items above graph maximum of 105.753
|
Instance 3 : First repeat imaging visit (2019+)
4,755 participants, 4,755 items
| Maximum | 111.052 |
| Decile 9 | 101.761 |
| Decile 8 | 101.21 |
| Decile 7 | 100.827 |
| Decile 6 | 100.451 |
| Median | 100.116 |
| Decile 4 | 99.7538 |
| Decile 3 | 99.3358 |
| Decile 2 | 98.7725 |
| Decile 1 | 97.8199 |
| Minimum | 74.3789 |
|

|
- Mean = 99.9086
- Std.dev = 1.77437
- 27 items below graph minimum of 93.8788
- 2 items above graph maximum of 105.702
|
Notes
Mean intensity of Pallidum in the left hemisphere generated by subcortical volumetric segmentation (aseg)
0 Related Data-Fields
There are no related data-fields
0 Resources
There are no matching Resources
