Data
87,996 items of data are available, covering 83,313 participants.
Defined-instances run from 2 to 3, labelled using Instancing
2.
Units of measurement are AU.
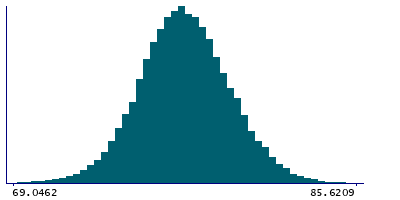
| Maximum | 87.7169 |
| Decile 9 | 80.2956 |
| Decile 8 | 79.284 |
| Decile 7 | 78.5537 |
| Decile 6 | 77.9548 |
| Median | 77.3958 |
| Decile 4 | 76.8594 |
| Decile 3 | 76.282 |
| Decile 2 | 75.616 |
| Decile 1 | 74.6644 |
| Minimum | 55.545 |
|
|
- Mean = 77.4323
- Std.dev = 2.25882
- 88 items below graph minimum of 69.0332
- 17 items above graph maximum of 85.9269
|
2 Instances
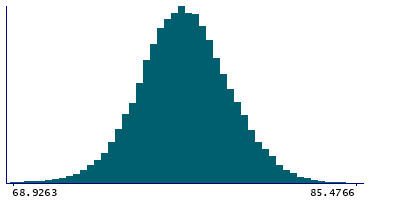
Instance 2 : Imaging visit (2014+)
83,241 participants, 83,241 items
| Maximum | 87.7169 |
| Decile 9 | 80.3123 |
| Decile 8 | 79.2955 |
| Decile 7 | 78.5647 |
| Decile 6 | 77.9629 |
| Median | 77.4047 |
| Decile 4 | 76.8646 |
| Decile 3 | 76.2861 |
| Decile 2 | 75.618 |
| Decile 1 | 74.6582 |
| Minimum | 55.545 |
|
|
- Mean = 77.4383
- Std.dev = 2.2657
- 81 items below graph minimum of 69.0041
- 15 items above graph maximum of 85.9664
|
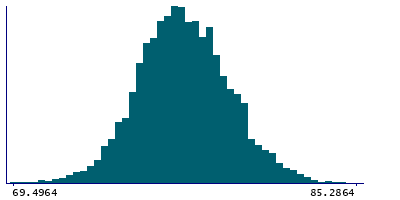
Instance 3 : First repeat imaging visit (2019+)
4,755 participants, 4,755 items
| Maximum | 86.125 |
| Decile 9 | 80.0231 |
| Decile 8 | 79.0691 |
| Decile 7 | 78.4184 |
| Decile 6 | 77.8185 |
| Median | 77.2791 |
| Decile 4 | 76.7572 |
| Decile 3 | 76.2144 |
| Decile 2 | 75.5879 |
| Decile 1 | 74.7621 |
| Minimum | 63.3026 |
|
|
- Mean = 77.3272
- Std.dev = 2.13201
- 4 items below graph minimum of 69.5011
- 4 items above graph maximum of 85.284
|
Notes
Mean intensity of Accumbens-area in the left hemisphere generated by subcortical volumetric segmentation (aseg)
0 Related Data-Fields
There are no related data-fields
0 Resources
There are no matching Resources
