Data
87,996 items of data are available, covering 83,313 participants.
Defined-instances run from 2 to 3, labelled using Instancing
2.
Units of measurement are AU.
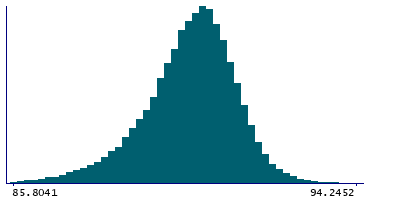
| Maximum | 101.923 |
| Decile 9 | 91.4422 |
| Decile 8 | 91.0433 |
| Decile 7 | 90.7523 |
| Decile 6 | 90.4997 |
| Median | 90.2461 |
| Decile 4 | 89.9732 |
| Decile 3 | 89.6609 |
| Decile 2 | 89.2534 |
| Decile 1 | 88.5926 |
| Minimum | 65.8773 |
|

|
- Mean = 90.1008
- Std.dev = 1.24243
- 398 items below graph minimum of 85.7431
- 15 items above graph maximum of 94.2918
|
2 Instances
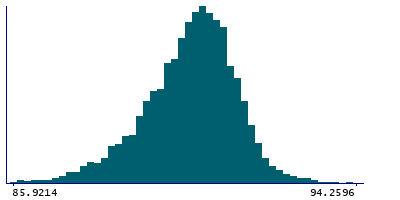
Instance 2 : Imaging visit (2014+)
83,241 participants, 83,241 items
| Maximum | 101.923 |
| Decile 9 | 91.439 |
| Decile 8 | 91.0402 |
| Decile 7 | 90.7475 |
| Decile 6 | 90.4959 |
| Median | 90.2411 |
| Decile 4 | 89.9683 |
| Decile 3 | 89.6559 |
| Decile 2 | 89.2488 |
| Decile 1 | 88.5865 |
| Minimum | 65.8773 |
|
|
- Mean = 90.0958
- Std.dev = 1.24284
- 381 items below graph minimum of 85.734
- 14 items above graph maximum of 94.2914
|
Instance 3 : First repeat imaging visit (2019+)
4,755 participants, 4,755 items
| Maximum | 95.1414 |
| Decile 9 | 91.48 |
| Decile 8 | 91.0958 |
| Decile 7 | 90.8283 |
| Decile 6 | 90.5824 |
| Median | 90.3273 |
| Decile 4 | 90.072 |
| Decile 3 | 89.7393 |
| Decile 2 | 89.3343 |
| Decile 1 | 88.7008 |
| Minimum | 68.3765 |
|
|
- Mean = 90.1896
- Std.dev = 1.23179
- 14 items below graph minimum of 85.9216
- 1 item above graph maximum of 94.2592
|
Notes
Mean intensity of VentralDC in the left hemisphere generated by subcortical volumetric segmentation (aseg)
0 Related Data-Fields
There are no related data-fields
0 Resources
There are no matching Resources
