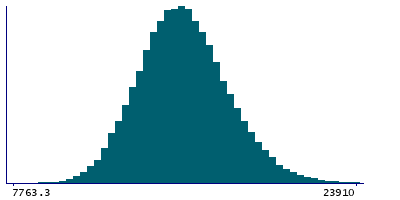
Data
87,996 items of data are available, covering 83,313 participants.
Defined-instances run from 2 to 3, labelled using Instancing
2.
Units of measurement are mm3.
| Maximum | 42933.2 |
| Decile 9 | 18416.4 |
| Decile 8 | 17364 |
| Decile 7 | 16663.2 |
| Decile 6 | 16073.5 |
| Median | 15548.3 |
| Decile 4 | 15028.7 |
| Decile 3 | 14483.2 |
| Decile 2 | 13859.7 |
| Decile 1 | 13003.2 |
| Minimum | 5731.7 |
|
|
- Mean = 15656.7
- Std.dev = 2171.45
- 11 items below graph minimum of 7589.9
- 187 items above graph maximum of 23829.7
|
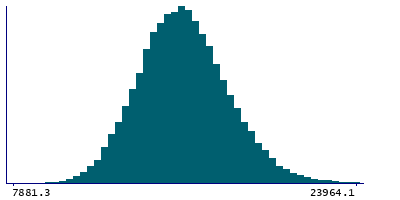
2 Instances
Instance 2 : Imaging visit (2014+)
83,241 participants, 83,241 items
| Maximum | 42933.2 |
| Decile 9 | 18401.9 |
| Decile 8 | 17350.3 |
| Decile 7 | 16644 |
| Decile 6 | 16057.8 |
| Median | 15528.1 |
| Decile 4 | 15012.5 |
| Decile 3 | 14466.2 |
| Decile 2 | 13843.5 |
| Decile 1 | 12984 |
| Minimum | 5731.7 |
|
|
- Mean = 15641.3
- Std.dev = 2174.43
- 9 items below graph minimum of 7566.1
- 182 items above graph maximum of 23819.8
|
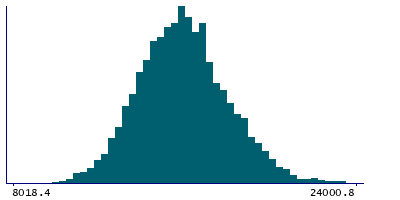
Instance 3 : First repeat imaging visit (2019+)
4,755 participants, 4,755 items
| Maximum | 28214.6 |
| Decile 9 | 18673.3 |
| Decile 8 | 17605.1 |
| Decile 7 | 16884.8 |
| Decile 6 | 16361.3 |
| Median | 15859.8 |
| Decile 4 | 15345.9 |
| Decile 3 | 14791.5 |
| Decile 2 | 14171.3 |
| Decile 1 | 13345.8 |
| Minimum | 7341.2 |
|
|
- Mean = 15925.9
- Std.dev = 2100.55
- 3 items below graph minimum of 8018.4
- 5 items above graph maximum of 24000.8
|
Notes
Volume of Cerebellum-White-Matter in the left hemisphere generated by subcortical volumetric segmentation (aseg)
0 Related Data-Fields
There are no related data-fields
0 Resources
There are no matching Resources
