Data
87,996 items of data are available, covering 83,313 participants.
Defined-instances run from 2 to 3, labelled using Instancing
2.
Units of measurement are mm3.
| Maximum | 6602.8 |
| Decile 9 | 4407.85 |
| Decile 8 | 4213.4 |
| Decile 7 | 4079.2 |
| Decile 6 | 3966.1 |
| Median | 3861.9 |
| Decile 4 | 3760.3 |
| Decile 3 | 3654.55 |
| Decile 2 | 3529.7 |
| Decile 1 | 3352.4 |
| Minimum | 1085.2 |
|
|
- Mean = 3872.81
- Std.dev = 419.236
- 23 items below graph minimum of 2296.95
- 30 items above graph maximum of 5463.3
|
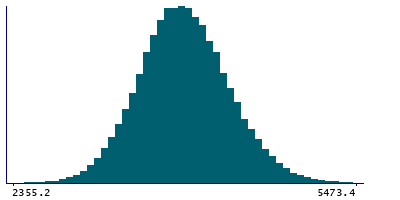
2 Instances
Instance 2 : Imaging visit (2014+)
83,241 participants, 83,241 items
| Maximum | 6602.8 |
| Decile 9 | 4404.15 |
| Decile 8 | 4210.2 |
| Decile 7 | 4076.2 |
| Decile 6 | 3963.1 |
| Median | 3858.4 |
| Decile 4 | 3757 |
| Decile 3 | 3650.6 |
| Decile 2 | 3525.75 |
| Decile 1 | 3348.65 |
| Minimum | 1314.4 |
|

|
- Mean = 3869.45
- Std.dev = 419.467
- 18 items below graph minimum of 2293.15
- 28 items above graph maximum of 5459.65
|
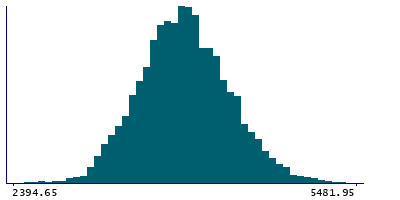
Instance 3 : First repeat imaging visit (2019+)
4,755 participants, 4,755 items
| Maximum | 6150.4 |
| Decile 9 | 4452.85 |
| Decile 8 | 4265.8 |
| Decile 7 | 4135.5 |
| Decile 6 | 4018.4 |
| Median | 3922.7 |
| Decile 4 | 3820.5 |
| Decile 3 | 3718.3 |
| Decile 2 | 3598.1 |
| Decile 1 | 3423.75 |
| Minimum | 1085.2 |
|
|
- Mean = 3931.64
- Std.dev = 410.739
- 5 items below graph minimum of 2394.65
- 3 items above graph maximum of 5481.95
|
Notes
Volume of Hippocampus in the left hemisphere generated by subcortical volumetric segmentation (aseg)
0 Related Data-Fields
There are no related data-fields
0 Resources
There are no matching Resources
