Data
87,996 items of data are available, covering 83,313 participants.
Defined-instances run from 2 to 3, labelled using Instancing
2.
Units of measurement are mm3.
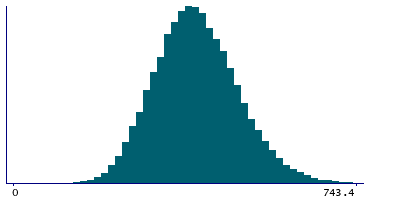
| Maximum | 1696.6 |
| Decile 9 | 507.1 |
| Decile 8 | 463.7 |
| Decile 7 | 433.3 |
| Decile 6 | 407.8 |
| Median | 385.1 |
| Decile 4 | 362.7 |
| Decile 3 | 339.2 |
| Decile 2 | 311.9 |
| Decile 1 | 275.9 |
| Minimum | 23.5 |
|
|
- Mean = 389.369
- Std.dev = 90.5591
- 41 items above graph maximum of 738.3
|
2 Instances
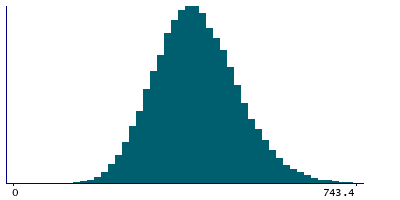
Instance 2 : Imaging visit (2014+)
83,241 participants, 83,241 items
| Maximum | 1696.6 |
| Decile 9 | 506.6 |
| Decile 8 | 463.2 |
| Decile 7 | 432.7 |
| Decile 6 | 407.2 |
| Median | 384.4 |
| Decile 4 | 362 |
| Decile 3 | 338.5 |
| Decile 2 | 311.2 |
| Decile 1 | 275.4 |
| Minimum | 23.5 |
|
|
- Mean = 388.719
- Std.dev = 90.6189
- 39 items above graph maximum of 737.8
|
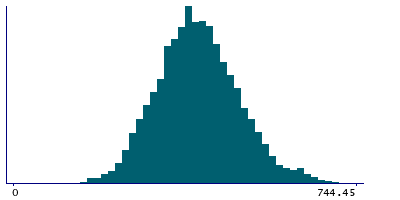
Instance 3 : First repeat imaging visit (2019+)
4,755 participants, 4,755 items
| Maximum | 761.3 |
| Decile 9 | 516.3 |
| Decile 8 | 473.1 |
| Decile 7 | 442.8 |
| Decile 6 | 419.3 |
| Median | 396.3 |
| Decile 4 | 375.9 |
| Decile 3 | 352.6 |
| Decile 2 | 327.1 |
| Decile 1 | 288.75 |
| Minimum | 43.3 |
|
|
- Mean = 400.746
- Std.dev = 88.7394
- 3 items above graph maximum of 743.85
|
Notes
Volume of Accumbens-area in the left hemisphere generated by subcortical volumetric segmentation (aseg)
0 Related Data-Fields
There are no related data-fields
0 Resources
There are no matching Resources
