Data
87,996 items of data are available, covering 83,313 participants.
Defined-instances run from 2 to 3, labelled using Instancing
2.
Units of measurement are mm3.
| Maximum | 2195.6 |
| Decile 9 | 1055.5 |
| Decile 8 | 926.9 |
| Decile 7 | 837.6 |
| Decile 6 | 764.25 |
| Median | 697.9 |
| Decile 4 | 633.1 |
| Decile 3 | 566.5 |
| Decile 2 | 493.7 |
| Decile 1 | 406.4 |
| Minimum | 87.6 |
|
|
- Mean = 717.977
- Std.dev = 251.174
- 43 items above graph maximum of 1704.6
|
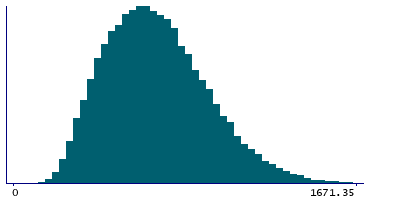
2 Instances
Instance 2 : Imaging visit (2014+)
83,241 participants, 83,241 items
| Maximum | 2195.6 |
| Decile 9 | 1057.3 |
| Decile 8 | 928.5 |
| Decile 7 | 839.4 |
| Decile 6 | 766.05 |
| Median | 699.3 |
| Decile 4 | 634.5 |
| Decile 3 | 568 |
| Decile 2 | 495.05 |
| Decile 1 | 407.4 |
| Minimum | 105.1 |
|

|
- Mean = 719.538
- Std.dev = 251.566
- 39 items above graph maximum of 1707.2
|
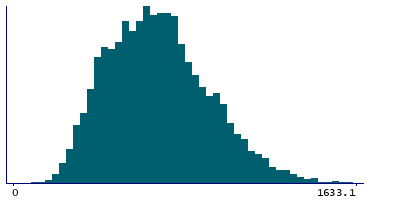
Instance 3 : First repeat imaging visit (2019+)
4,755 participants, 4,755 items
| Maximum | 1787.7 |
| Decile 9 | 1013.05 |
| Decile 8 | 893 |
| Decile 7 | 800.3 |
| Decile 6 | 735.8 |
| Median | 672.35 |
| Decile 4 | 613.1 |
| Decile 3 | 543.65 |
| Decile 2 | 472.2 |
| Decile 1 | 393 |
| Minimum | 87.6 |
|
|
- Mean = 690.635
- Std.dev = 242.596
- 5 items above graph maximum of 1633.1
|
Notes
Volume of choroid-plexus in the left hemisphere generated by subcortical volumetric segmentation (aseg)
0 Related Data-Fields
There are no related data-fields
0 Resources
There are no matching Resources
