Data
87,996 items of data are available, covering 83,313 participants.
Defined-instances run from 2 to 3, labelled using Instancing
2.
Units of measurement are AU.
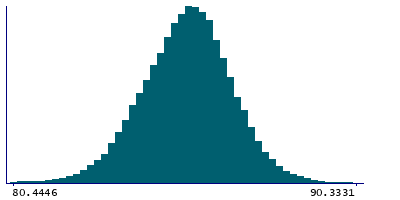
| Maximum | 93.3004 |
| Decile 9 | 87.0384 |
| Decile 8 | 86.4891 |
| Decile 7 | 86.1013 |
| Decile 6 | 85.7776 |
| Median | 85.4698 |
| Decile 4 | 85.1448 |
| Decile 3 | 84.7882 |
| Decile 2 | 84.3432 |
| Decile 1 | 83.7207 |
| Minimum | 51.8125 |
|
|
- Mean = 85.4074
- Std.dev = 1.37152
- 251 items below graph minimum of 80.4031
- 61 items above graph maximum of 90.356
|
2 Instances
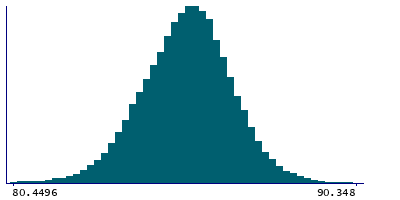
Instance 2 : Imaging visit (2014+)
83,241 participants, 83,241 items
| Maximum | 93.3004 |
| Decile 9 | 87.0478 |
| Decile 8 | 86.5006 |
| Decile 7 | 86.1119 |
| Decile 6 | 85.7862 |
| Median | 85.4766 |
| Decile 4 | 85.152 |
| Decile 3 | 84.794 |
| Decile 2 | 84.3479 |
| Decile 1 | 83.727 |
| Minimum | 51.8125 |
|
|
- Mean = 85.4156
- Std.dev = 1.37315
- 233 items below graph minimum of 80.4062
- 61 items above graph maximum of 90.3686
|
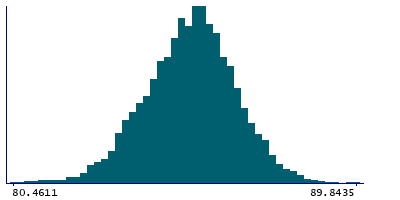
Instance 3 : First repeat imaging visit (2019+)
4,755 participants, 4,755 items
| Maximum | 89.8435 |
| Decile 9 | 86.8183 |
| Decile 8 | 86.3086 |
| Decile 7 | 85.945 |
| Decile 6 | 85.6249 |
| Median | 85.349 |
| Decile 4 | 85.0298 |
| Decile 3 | 84.6771 |
| Decile 2 | 84.2523 |
| Decile 1 | 83.6402 |
| Minimum | 64.9296 |
|
|
- Mean = 85.2645
- Std.dev = 1.33457
- 20 items below graph minimum of 80.4622
|
Notes
Mean intensity of Cerebellum-White-Matter in the right hemisphere generated by subcortical volumetric segmentation (aseg)
0 Related Data-Fields
There are no related data-fields
0 Resources
There are no matching Resources
