Data
87,996 items of data are available, covering 83,313 participants.
Defined-instances run from 2 to 3, labelled using Instancing
2.
Units of measurement are AU.
| Maximum | 100.692 |
| Decile 9 | 81.2699 |
| Decile 8 | 80.3409 |
| Decile 7 | 79.7042 |
| Decile 6 | 79.1697 |
| Median | 78.6702 |
| Decile 4 | 78.1763 |
| Decile 3 | 77.6589 |
| Decile 2 | 77.0178 |
| Decile 1 | 76.0532 |
| Minimum | 45.1367 |
|

|
- Mean = 78.6481
- Std.dev = 2.13329
- 139 items below graph minimum of 70.8365
- 11 items above graph maximum of 86.4867
|
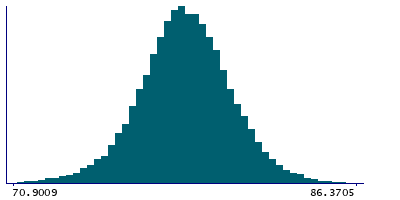
2 Instances
Instance 2 : Imaging visit (2014+)
83,241 participants, 83,241 items
| Maximum | 100.692 |
| Decile 9 | 81.2728 |
| Decile 8 | 80.3441 |
| Decile 7 | 79.7035 |
| Decile 6 | 79.1663 |
| Median | 78.6667 |
| Decile 4 | 78.172 |
| Decile 3 | 77.6529 |
| Decile 2 | 77.0122 |
| Decile 1 | 76.0461 |
| Minimum | 45.1367 |
|
|
- Mean = 78.6456
- Std.dev = 2.13958
- 133 items below graph minimum of 70.8194
- 10 items above graph maximum of 86.4994
|
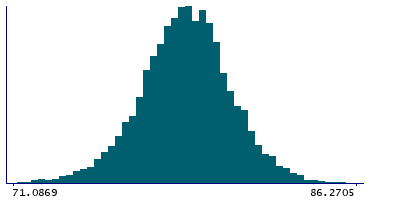
Instance 3 : First repeat imaging visit (2019+)
4,755 participants, 4,755 items
| Maximum | 88.0338 |
| Decile 9 | 81.2093 |
| Decile 8 | 80.2851 |
| Decile 7 | 79.7198 |
| Decile 6 | 79.2423 |
| Median | 78.7361 |
| Decile 4 | 78.2537 |
| Decile 3 | 77.743 |
| Decile 2 | 77.1193 |
| Decile 1 | 76.1519 |
| Minimum | 69.3288 |
|
|
- Mean = 78.691
- Std.dev = 2.01962
- 5 items below graph minimum of 71.0945
- 1 item above graph maximum of 86.2667
|
Notes
Mean intensity of Caudate in the right hemisphere generated by subcortical volumetric segmentation (aseg)
0 Related Data-Fields
There are no related data-fields
0 Resources
There are no matching Resources
