Data
87,996 items of data are available, covering 83,313 participants.
Defined-instances run from 2 to 3, labelled using Instancing
2.
Units of measurement are AU.
| Maximum | 94.4347 |
| Decile 9 | 87.7561 |
| Decile 8 | 87.0452 |
| Decile 7 | 86.5306 |
| Decile 6 | 86.0315 |
| Median | 85.527 |
| Decile 4 | 85.0327 |
| Decile 3 | 84.5262 |
| Decile 2 | 83.939 |
| Decile 1 | 83.0594 |
| Minimum | 49.0084 |
|

|
- Mean = 85.4533
- Std.dev = 1.93087
- 189 items below graph minimum of 78.3627
- 4 items above graph maximum of 92.4527
|
2 Instances
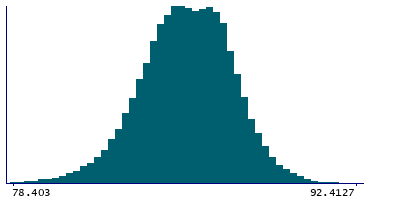
Instance 2 : Imaging visit (2014+)
83,241 participants, 83,241 items
| Maximum | 94.4347 |
| Decile 9 | 87.7571 |
| Decile 8 | 87.0446 |
| Decile 7 | 86.5284 |
| Decile 6 | 86.0295 |
| Median | 85.5232 |
| Decile 4 | 85.0279 |
| Decile 3 | 84.5231 |
| Decile 2 | 83.9337 |
| Decile 1 | 83.0551 |
| Minimum | 49.0084 |
|
|
- Mean = 85.4509
- Std.dev = 1.93353
- 183 items below graph minimum of 78.353
- 4 items above graph maximum of 92.4592
|
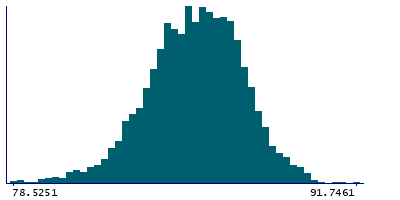
Instance 3 : First repeat imaging visit (2019+)
4,755 participants, 4,755 items
| Maximum | 91.7461 |
| Decile 9 | 87.737 |
| Decile 8 | 87.0652 |
| Decile 7 | 86.5693 |
| Decile 6 | 86.0606 |
| Median | 85.5978 |
| Decile 4 | 85.1303 |
| Decile 3 | 84.5831 |
| Decile 2 | 84.0294 |
| Decile 1 | 83.1362 |
| Minimum | 71.2668 |
|
|
- Mean = 85.4964
- Std.dev = 1.88329
- 9 items below graph minimum of 78.5354
|
Notes
Mean intensity of Putamen in the right hemisphere generated by subcortical volumetric segmentation (aseg)
0 Related Data-Fields
There are no related data-fields
0 Resources
There are no matching Resources
