Data
87,996 items of data are available, covering 83,313 participants.
Defined-instances run from 2 to 3, labelled using Instancing
2.
Units of measurement are AU.
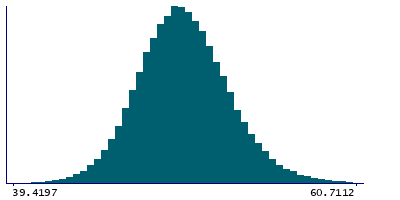
| Maximum | 64.1325 |
| Decile 9 | 53.4137 |
| Decile 8 | 52.0747 |
| Decile 7 | 51.1467 |
| Decile 6 | 50.3786 |
| Median | 49.6835 |
| Decile 4 | 49.0063 |
| Decile 3 | 48.2872 |
| Decile 2 | 47.4613 |
| Decile 1 | 46.3147 |
| Minimum | 36.2634 |
|
|
- Mean = 49.7976
- Std.dev = 2.84113
- 5 items below graph minimum of 39.2156
- 65 items above graph maximum of 60.5128
|
2 Instances
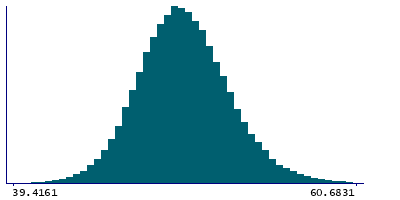
Instance 2 : Imaging visit (2014+)
83,241 participants, 83,241 items
| Maximum | 64.1325 |
| Decile 9 | 53.394 |
| Decile 8 | 52.0558 |
| Decile 7 | 51.1271 |
| Decile 6 | 50.3578 |
| Median | 49.6589 |
| Decile 4 | 48.9796 |
| Decile 3 | 48.2612 |
| Decile 2 | 47.4388 |
| Decile 1 | 46.298 |
| Minimum | 36.2634 |
|
|
- Mean = 49.7764
- Std.dev = 2.83979
- 4 items below graph minimum of 39.202
- 61 items above graph maximum of 60.49
|
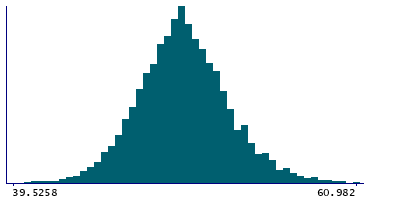
Instance 3 : First repeat imaging visit (2019+)
4,755 participants, 4,755 items
| Maximum | 61.3799 |
| Decile 9 | 53.8299 |
| Decile 8 | 52.3578 |
| Decile 7 | 51.4852 |
| Decile 6 | 50.7271 |
| Median | 50.076 |
| Decile 4 | 49.4537 |
| Decile 3 | 48.724 |
| Decile 2 | 47.8812 |
| Decile 1 | 46.6778 |
| Minimum | 39.2125 |
|
|
- Mean = 50.1678
- Std.dev = 2.83898
- 1 item below graph minimum of 39.5258
- 3 items above graph maximum of 60.982
|
Notes
Mean intensity of choroid-plexus in the right hemisphere generated by subcortical volumetric segmentation (aseg)
0 Related Data-Fields
There are no related data-fields
0 Resources
There are no matching Resources
