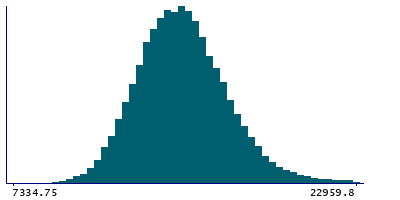
Data
87,996 items of data are available, covering 83,313 participants.
Defined-instances run from 2 to 3, labelled using Instancing
2.
Units of measurement are mm3.
| Maximum | 41131.6 |
| Decile 9 | 17670.8 |
| Decile 8 | 16608.3 |
| Decile 7 | 15895.2 |
| Decile 6 | 15332.5 |
| Median | 14829 |
| Decile 4 | 14324.2 |
| Decile 3 | 13797.5 |
| Decile 2 | 13213.3 |
| Decile 1 | 12404.7 |
| Minimum | 4967.7 |
|
|
- Mean = 15001.1
- Std.dev = 2252.96
- 9 items below graph minimum of 7138.6
- 653 items above graph maximum of 22936.9
|
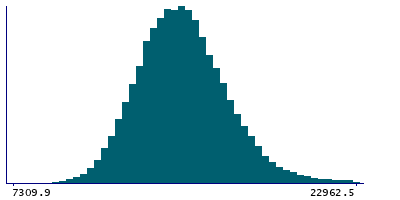
2 Instances
Instance 2 : Imaging visit (2014+)
83,241 participants, 83,241 items
| Maximum | 41131.6 |
| Decile 9 | 17660 |
| Decile 8 | 16594 |
| Decile 7 | 15878.7 |
| Decile 6 | 15316.8 |
| Median | 14810.9 |
| Decile 4 | 14308.3 |
| Decile 3 | 13781.2 |
| Decile 2 | 13198.1 |
| Decile 1 | 12388.4 |
| Minimum | 4967.7 |
|
|
- Mean = 14986.1
- Std.dev = 2254.74
- 7 items below graph minimum of 7116.65
- 607 items above graph maximum of 22931.8
|
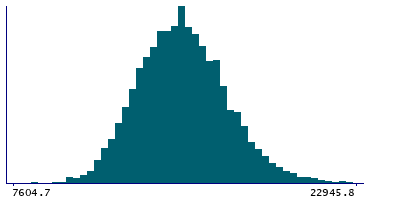
Instance 3 : First repeat imaging visit (2019+)
4,755 participants, 4,755 items
| Maximum | 28075.5 |
| Decile 9 | 17832.1 |
| Decile 8 | 16827.4 |
| Decile 7 | 16161.9 |
| Decile 6 | 15608.4 |
| Median | 15124.9 |
| Decile 4 | 14620.3 |
| Decile 3 | 14092.1 |
| Decile 2 | 13493.6 |
| Decile 1 | 12718.4 |
| Minimum | 5795.8 |
|
|
- Mean = 15264.8
- Std.dev = 2204.85
- 2 items below graph minimum of 7604.7
- 48 items above graph maximum of 22945.8
|
Notes
Volume of Cerebellum-White-Matter in the right hemisphere generated by subcortical volumetric segmentation (aseg)
0 Related Data-Fields
There are no related data-fields
0 Resources
There are no matching Resources
