Data
87,996 items of data are available, covering 83,313 participants.
Defined-instances run from 2 to 3, labelled using Instancing
2.
Units of measurement are mm3.
| Maximum | 959.435 |
| Decile 9 | 644.86 |
| Decile 8 | 609.766 |
| Decile 7 | 585.27 |
| Decile 6 | 564.887 |
| Median | 546.645 |
| Decile 4 | 528.782 |
| Decile 3 | 509.837 |
| Decile 2 | 487.855 |
| Decile 1 | 457.189 |
| Minimum | 121.133 |
|
|
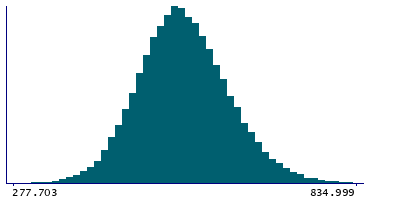
- Mean = 549.262
- Std.dev = 74.6559
- 14 items below graph minimum of 269.519
- 49 items above graph maximum of 832.53
|
2 Instances
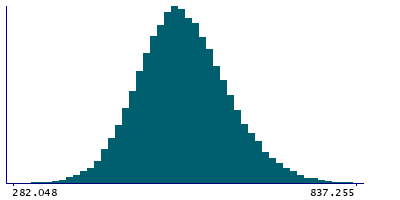
Instance 2 : Imaging visit (2014+)
83,241 participants, 83,241 items
| Maximum | 959.435 |
| Decile 9 | 644.238 |
| Decile 8 | 609.104 |
| Decile 7 | 584.625 |
| Decile 6 | 564.277 |
| Median | 545.917 |
| Decile 4 | 528.139 |
| Decile 3 | 509.192 |
| Decile 2 | 487.148 |
| Decile 1 | 456.513 |
| Minimum | 186.768 |
|
|
- Mean = 548.618
- Std.dev = 74.7019
- 11 items below graph minimum of 268.789
- 46 items above graph maximum of 831.962
|
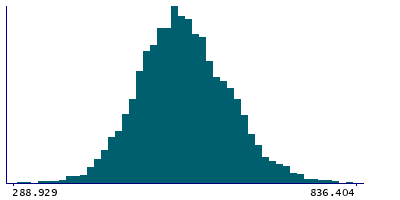
Instance 3 : First repeat imaging visit (2019+)
4,755 participants, 4,755 items
| Maximum | 852.551 |
| Decile 9 | 653.912 |
| Decile 8 | 622.081 |
| Decile 7 | 595.8 |
| Decile 6 | 575.587 |
| Median | 557.397 |
| Decile 4 | 540.615 |
| Decile 3 | 522.179 |
| Decile 2 | 500.407 |
| Decile 1 | 471.421 |
| Minimum | 121.133 |
|
|
- Mean = 560.523
- Std.dev = 72.9336
- 3 items below graph minimum of 288.929
- 3 items above graph maximum of 836.404
|
Notes
Volume of CA1-head in the left hemisphere generated by subcortical volumetric sub-segmentation of the Hippocampal Subfields
0 Related Data-Fields
There are no related data-fields
0 Resources
There are no matching Resources
