Data
87,996 items of data are available, covering 83,313 participants.
Defined-instances run from 2 to 3, labelled using Instancing
2.
Units of measurement are mm3.
| Maximum | 6773.86 |
| Decile 9 | 4119.75 |
| Decile 8 | 3927.68 |
| Decile 7 | 3796.53 |
| Decile 6 | 3688.07 |
| Median | 3586.99 |
| Decile 4 | 3486.19 |
| Decile 3 | 3381.68 |
| Decile 2 | 3256.17 |
| Decile 1 | 3084.8 |
| Minimum | 875.485 |
|

|
- Mean = 3594.86
- Std.dev = 410.434
- 11 items below graph minimum of 2049.86
- 40 items above graph maximum of 5154.7
|
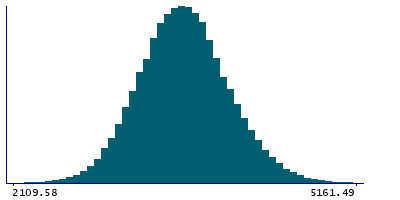
2 Instances
Instance 2 : Imaging visit (2014+)
83,241 participants, 83,241 items
| Maximum | 6773.86 |
| Decile 9 | 4116.14 |
| Decile 8 | 3924.09 |
| Decile 7 | 3792.68 |
| Decile 6 | 3684.27 |
| Median | 3583.07 |
| Decile 4 | 3482.66 |
| Decile 3 | 3377.62 |
| Decile 2 | 3251.82 |
| Decile 1 | 3080.34 |
| Minimum | 1531.61 |
|
|
- Mean = 3590.99
- Std.dev = 410.618
- 7 items below graph minimum of 2044.53
- 38 items above graph maximum of 5151.95
|
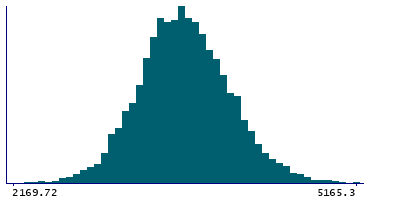
Instance 3 : First repeat imaging visit (2019+)
4,755 participants, 4,755 items
| Maximum | 5770.96 |
| Decile 9 | 4166.77 |
| Decile 8 | 3987.71 |
| Decile 7 | 3858.19 |
| Decile 6 | 3749.28 |
| Median | 3649.26 |
| Decile 4 | 3553.8 |
| Decile 3 | 3454.16 |
| Decile 2 | 3340.68 |
| Decile 1 | 3168.25 |
| Minimum | 875.485 |
|
|
- Mean = 3662.54
- Std.dev = 401.216
- 5 items below graph minimum of 2169.72
- 2 items above graph maximum of 5165.3
|
Notes
Volume of Whole-hippocampus in the left hemisphere generated by subcortical volumetric sub-segmentation of the Hippocampal Subfields
0 Related Data-Fields
There are no related data-fields
0 Resources
There are no matching Resources
