Data
87,996 items of data are available, covering 83,313 participants.
Defined-instances run from 2 to 3, labelled using Instancing
2.
Units of measurement are mm3.
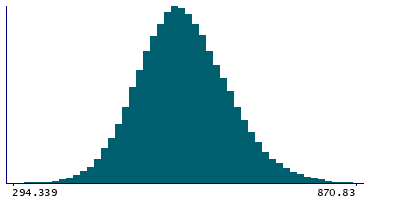
| Maximum | 1515.1 |
| Decile 9 | 674.706 |
| Decile 8 | 638.025 |
| Decile 7 | 612.157 |
| Decile 6 | 591.219 |
| Median | 572.294 |
| Decile 4 | 553.876 |
| Decile 3 | 533.958 |
| Decile 2 | 511.527 |
| Decile 1 | 480.363 |
| Minimum | 138.46 |
|
|
- Mean = 575.2
- Std.dev = 77.3722
- 22 items below graph minimum of 286.02
- 48 items above graph maximum of 869.049
|
2 Instances
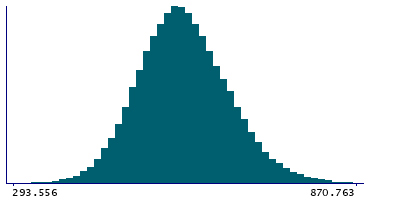
Instance 2 : Imaging visit (2014+)
83,241 participants, 83,241 items
| Maximum | 1515.1 |
| Decile 9 | 674.208 |
| Decile 8 | 637.469 |
| Decile 7 | 611.557 |
| Decile 6 | 590.63 |
| Median | 571.649 |
| Decile 4 | 553.224 |
| Decile 3 | 533.257 |
| Decile 2 | 510.817 |
| Decile 1 | 479.651 |
| Minimum | 138.46 |
|
|
- Mean = 574.57
- Std.dev = 77.449
- 21 items below graph minimum of 285.095
- 45 items above graph maximum of 868.764
|
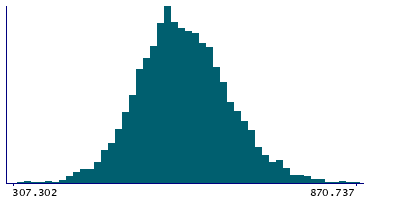
Instance 3 : First repeat imaging visit (2019+)
4,755 participants, 4,755 items
| Maximum | 912.17 |
| Decile 9 | 682.925 |
| Decile 8 | 646.798 |
| Decile 7 | 623.156 |
| Decile 6 | 602.63 |
| Median | 582.526 |
| Decile 4 | 563.615 |
| Decile 3 | 546.3 |
| Decile 2 | 524.187 |
| Decile 1 | 495.113 |
| Minimum | 269.642 |
|
|
- Mean = 586.23
- Std.dev = 75.1639
- 1 item below graph minimum of 307.302
- 4 items above graph maximum of 870.737
|
Notes
Volume of CA1-head in the right hemisphere generated by subcortical volumetric sub-segmentation of the Hippocampal Subfields
0 Related Data-Fields
There are no related data-fields
0 Resources
There are no matching Resources
