Data
87,996 items of data are available, covering 83,313 participants.
Defined-instances run from 2 to 3, labelled using Instancing
2.
Units of measurement are mm3.
| Maximum | 2246.36 |
| Decile 9 | 916.031 |
| Decile 8 | 869.663 |
| Decile 7 | 837.715 |
| Decile 6 | 810.927 |
| Median | 787.037 |
| Decile 4 | 763.492 |
| Decile 3 | 739.696 |
| Decile 2 | 712.712 |
| Decile 1 | 676.67 |
| Minimum | 409.808 |
|
|
- Mean = 792.897
- Std.dev = 94.9354
- 3 items below graph minimum of 437.309
- 84 items above graph maximum of 1155.39
|
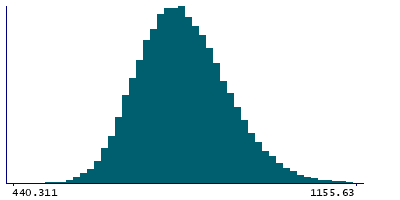
2 Instances
Instance 2 : Imaging visit (2014+)
83,241 participants, 83,241 items
| Maximum | 2226.48 |
| Decile 9 | 915.903 |
| Decile 8 | 869.644 |
| Decile 7 | 837.466 |
| Decile 6 | 810.786 |
| Median | 786.895 |
| Decile 4 | 763.269 |
| Decile 3 | 739.536 |
| Decile 2 | 712.51 |
| Decile 1 | 676.305 |
| Minimum | 409.808 |
|

|
- Mean = 792.719
- Std.dev = 94.884
- 2 items below graph minimum of 436.707
- 78 items above graph maximum of 1155.5
|
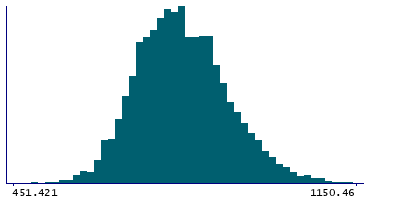
Instance 3 : First repeat imaging visit (2019+)
4,755 participants, 4,755 items
| Maximum | 2246.36 |
| Decile 9 | 917.032 |
| Decile 8 | 870.277 |
| Decile 7 | 840.896 |
| Decile 6 | 814.008 |
| Median | 789.662 |
| Decile 4 | 766.56 |
| Decile 3 | 743.048 |
| Decile 2 | 715.951 |
| Decile 1 | 684.433 |
| Minimum | 413.617 |
|
|
- Mean = 796.011
- Std.dev = 95.7776
- 2 items below graph minimum of 451.833
- 6 items above graph maximum of 1149.63
|
Notes
Volume of VPL in the left hemisphere generated by subcortical volumetric sub-segmentation of the Thalamic Nuclei
0 Related Data-Fields
There are no related data-fields
0 Resources
There are no matching Resources
