Data
87,996 items of data are available, covering 83,313 participants.
Defined-instances run from 2 to 3, labelled using Instancing
2.
Units of measurement are mm3.
| Maximum | 1643.5 |
| Decile 9 | 659.069 |
| Decile 8 | 624.118 |
| Decile 7 | 600.425 |
| Decile 6 | 580.905 |
| Median | 563.224 |
| Decile 4 | 546.101 |
| Decile 3 | 528.701 |
| Decile 2 | 508.856 |
| Decile 1 | 483.128 |
| Minimum | 265.013 |
|
|
- Mean = 568.012
- Std.dev = 69.6087
- 2 items below graph minimum of 307.186
- 71 items above graph maximum of 835.011
|
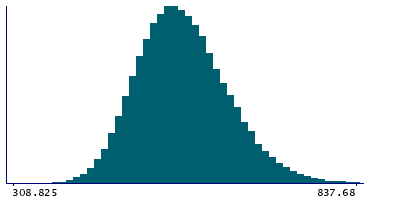
2 Instances
Instance 2 : Imaging visit (2014+)
83,241 participants, 83,241 items
| Maximum | 1643.5 |
| Decile 9 | 658.793 |
| Decile 8 | 623.904 |
| Decile 7 | 600.226 |
| Decile 6 | 580.675 |
| Median | 562.956 |
| Decile 4 | 545.804 |
| Decile 3 | 528.404 |
| Decile 2 | 508.631 |
| Decile 1 | 482.932 |
| Minimum | 265.013 |
|

|
- Mean = 567.774
- Std.dev = 69.5141
- 2 items below graph minimum of 307.071
- 67 items above graph maximum of 834.654
|
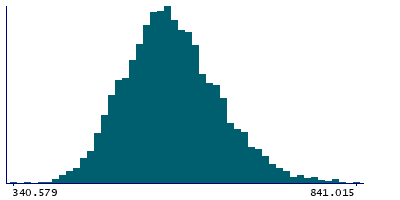
Instance 3 : First repeat imaging visit (2019+)
4,755 participants, 4,755 items
| Maximum | 1378.35 |
| Decile 9 | 663.545 |
| Decile 8 | 628.779 |
| Decile 7 | 603.549 |
| Decile 6 | 584.353 |
| Median | 567.279 |
| Decile 4 | 550.561 |
| Decile 3 | 533.931 |
| Decile 2 | 512.997 |
| Decile 1 | 486.241 |
| Minimum | 340.579 |
|
|
- Mean = 572.169
- Std.dev = 71.1167
- 6 items above graph maximum of 840.849
|
Notes
Volume of VLa in the left hemisphere generated by subcortical volumetric sub-segmentation of the Thalamic Nuclei
0 Related Data-Fields
There are no related data-fields
0 Resources
There are no matching Resources
