Data
87,996 items of data are available, covering 83,313 participants.
Defined-instances run from 2 to 3, labelled using Instancing
2.
Units of measurement are mm3.
| Maximum | 171.851 |
| Decile 9 | 60.0004 |
| Decile 8 | 55.7311 |
| Decile 7 | 52.7753 |
| Decile 6 | 50.332 |
| Median | 48.1213 |
| Decile 4 | 45.9499 |
| Decile 3 | 43.7539 |
| Decile 2 | 41.1545 |
| Decile 1 | 37.7722 |
| Minimum | 14.9038 |
|
|
- Mean = 48.6171
- Std.dev = 8.81341
- 98 items above graph maximum of 82.2286
|
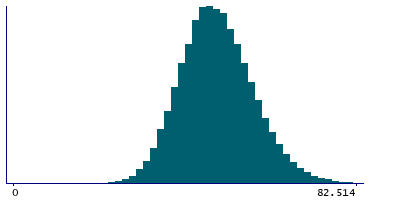
2 Instances
Instance 2 : Imaging visit (2014+)
83,241 participants, 83,241 items
| Maximum | 171.851 |
| Decile 9 | 59.9856 |
| Decile 8 | 55.6791 |
| Decile 7 | 52.7321 |
| Decile 6 | 50.2943 |
| Median | 48.0778 |
| Decile 4 | 45.9088 |
| Decile 3 | 43.7077 |
| Decile 2 | 41.1141 |
| Decile 1 | 37.7289 |
| Minimum | 14.9038 |
|

|
- Mean = 48.5765
- Std.dev = 8.81643
- 92 items above graph maximum of 82.2423
|
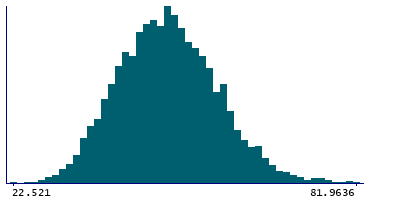
Instance 3 : First repeat imaging visit (2019+)
4,755 participants, 4,755 items
| Maximum | 134.811 |
| Decile 9 | 60.2342 |
| Decile 8 | 56.391 |
| Decile 7 | 53.576 |
| Decile 6 | 51.1329 |
| Median | 49.0746 |
| Decile 4 | 46.8039 |
| Decile 3 | 44.4908 |
| Decile 2 | 41.8333 |
| Decile 1 | 38.5048 |
| Minimum | 22.521 |
|
|
- Mean = 49.3286
- Std.dev = 8.72973
- 6 items above graph maximum of 81.9636
|
Notes
Volume of CeM in the left hemisphere generated by subcortical volumetric sub-segmentation of the Thalamic Nuclei
0 Related Data-Fields
There are no related data-fields
0 Resources
There are no matching Resources
