Data
87,996 items of data are available, covering 83,313 participants.
Defined-instances run from 2 to 3, labelled using Instancing
2.
Units of measurement are mm3.
| Maximum | 6.71654 |
| Decile 9 | 3.64633 |
| Decile 8 | 3.39409 |
| Decile 7 | 3.2201 |
| Decile 6 | 3.07922 |
| Median | 2.9475 |
| Decile 4 | 2.82018 |
| Decile 3 | 2.68829 |
| Decile 2 | 2.54029 |
| Decile 1 | 2.34017 |
| Minimum | 0.545245 |
|

|
- Mean = 2.97501
- Std.dev = 0.514446
- 61 items above graph maximum of 4.95249
|
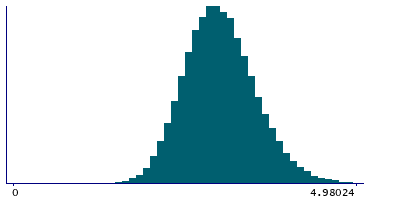
2 Instances
Instance 2 : Imaging visit (2014+)
83,241 participants, 83,241 items
| Maximum | 6.71654 |
| Decile 9 | 3.64408 |
| Decile 8 | 3.39049 |
| Decile 7 | 3.21626 |
| Decile 6 | 3.07471 |
| Median | 2.94301 |
| Decile 4 | 2.81629 |
| Decile 3 | 2.68442 |
| Decile 2 | 2.53685 |
| Decile 1 | 2.33706 |
| Minimum | 0.545245 |
|
|
- Mean = 2.97151
- Std.dev = 0.51465
- 58 items above graph maximum of 4.95111
|
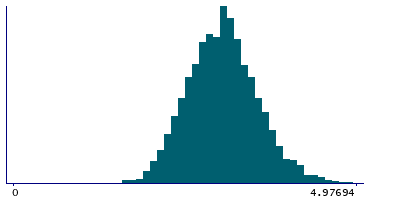
Instance 3 : First repeat imaging visit (2019+)
4,755 participants, 4,755 items
| Maximum | 5.24311 |
| Decile 9 | 3.68522 |
| Decile 8 | 3.45031 |
| Decile 7 | 3.27378 |
| Decile 6 | 3.14304 |
| Median | 3.03107 |
| Decile 4 | 2.89468 |
| Decile 3 | 2.7638 |
| Decile 2 | 2.60136 |
| Decile 1 | 2.3949 |
| Minimum | 1.12266 |
|
|
- Mean = 3.03633
- Std.dev = 0.506946
- 3 items above graph maximum of 4.97554
|
Notes
Volume of Pc in the right hemisphere generated by subcortical volumetric sub-segmentation of the Thalamic Nuclei
0 Related Data-Fields
There are no related data-fields
0 Resources
There are no matching Resources
