Data
87,996 items of data are available, covering 83,313 participants.
Defined-instances run from 2 to 3, labelled using Instancing
2.
Units of measurement are mm3.
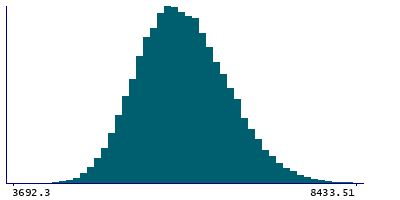
| Maximum | 9452.3 |
| Decile 9 | 6836.16 |
| Decile 8 | 6542.81 |
| Decile 7 | 6329.58 |
| Decile 6 | 6153.6 |
| Median | 5990.69 |
| Decile 4 | 5835.21 |
| Decile 3 | 5674.99 |
| Decile 2 | 5496.75 |
| Decile 1 | 5259.65 |
| Minimum | 3202.01 |
|
|
- Mean = 6026.47
- Std.dev = 615.915
- 1 item below graph minimum of 3683.13
- 31 items above graph maximum of 8412.68
|
2 Instances
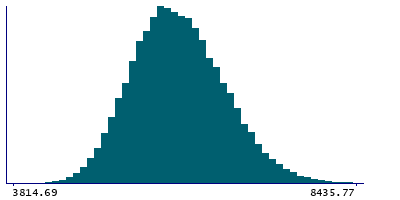
Instance 2 : Imaging visit (2014+)
83,241 participants, 83,241 items
| Maximum | 9452.3 |
| Decile 9 | 6835.36 |
| Decile 8 | 6541.8 |
| Decile 7 | 6328.75 |
| Decile 6 | 6152.28 |
| Median | 5989.17 |
| Decile 4 | 5833.8 |
| Decile 3 | 5673.85 |
| Decile 2 | 5495.55 |
| Decile 1 | 5258.07 |
| Minimum | 3814.69 |
|
|
- Mean = 6025.24
- Std.dev = 616.108
- 30 items above graph maximum of 8412.64
|
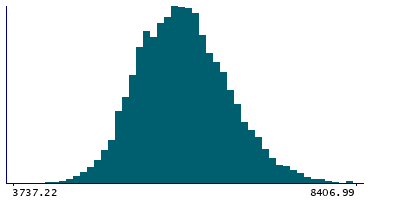
Instance 3 : First repeat imaging visit (2019+)
4,755 participants, 4,755 items
| Maximum | 8617.49 |
| Decile 9 | 6850.17 |
| Decile 8 | 6555.09 |
| Decile 7 | 6344.92 |
| Decile 6 | 6174.4 |
| Median | 6021.33 |
| Decile 4 | 5868.2 |
| Decile 3 | 5700.95 |
| Decile 2 | 5514.33 |
| Decile 1 | 5293.81 |
| Minimum | 3202.01 |
|
|
- Mean = 6048.07
- Std.dev = 612.116
- 1 item below graph minimum of 3737.45
- 2 items above graph maximum of 8406.53
|
Notes
Volume of Midbrain in the whole brain generated by subcortical volumetric sub-segmentation of the Brainstem
0 Related Data-Fields
There are no related data-fields
0 Resources
There are no matching Resources
