Data
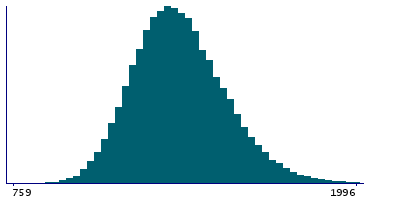
87,996 items of data are available, covering 83,313 participants.
Defined-instances run from 2 to 3, labelled using Instancing
2.
Units of measurement are mm2.
| Maximum | 3022 |
| Decile 9 | 1573 |
| Decile 8 | 1490 |
| Decile 7 | 1432 |
| Decile 6 | 1386 |
| Median | 1344 |
| Decile 4 | 1304 |
| Decile 3 | 1261 |
| Decile 2 | 1215 |
| Decile 1 | 1153 |
| Minimum | 759 |
|
|
- Mean = 1355.95
- Std.dev = 166.947
- 100 items above graph maximum of 1993
|
2 Instances
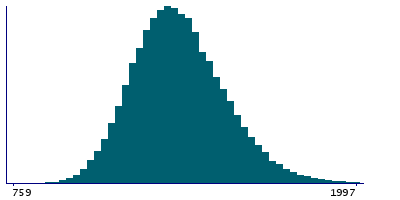
Instance 2 : Imaging visit (2014+)
83,241 participants, 83,241 items
| Maximum | 3022 |
| Decile 9 | 1573 |
| Decile 8 | 1490 |
| Decile 7 | 1432 |
| Decile 6 | 1386 |
| Median | 1344 |
| Decile 4 | 1303 |
| Decile 3 | 1261 |
| Decile 2 | 1214 |
| Decile 1 | 1153 |
| Minimum | 759 |
|
|
- Mean = 1355.51
- Std.dev = 167.165
- 94 items above graph maximum of 1993
|
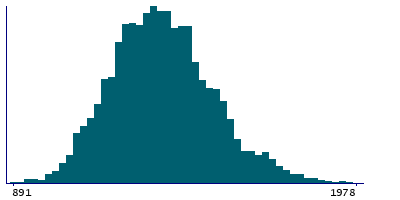
Instance 3 : First repeat imaging visit (2019+)
4,755 participants, 4,755 items
| Maximum | 2164 |
| Decile 9 | 1571 |
| Decile 8 | 1494 |
| Decile 7 | 1439 |
| Decile 6 | 1395 |
| Median | 1355 |
| Decile 4 | 1314 |
| Decile 3 | 1270 |
| Decile 2 | 1227 |
| Decile 1 | 1164 |
| Minimum | 891 |
|
|
- Mean = 1363.55
- Std.dev = 162.895
- 7 items above graph maximum of 1978
|
Notes
Area of paracentral in the left hemisphere generated by parcellation of the white surface using Desikan-Killiany parcellation
0 Related Data-Fields
There are no related data-fields
0 Resources
There are no matching Resources
