Data
87,996 items of data are available, covering 83,313 participants.
Defined-instances run from 2 to 3, labelled using Instancing
2.
Units of measurement are mm2.
| Maximum | 1911 |
| Decile 9 | 896 |
| Decile 8 | 830 |
| Decile 7 | 785 |
| Decile 6 | 750 |
| Median | 719 |
| Decile 4 | 689 |
| Decile 3 | 659 |
| Decile 2 | 625 |
| Decile 1 | 581 |
| Minimum | 54 |
|
|
- Mean = 731.669
- Std.dev = 129.254
- 312 items above graph maximum of 1211
|
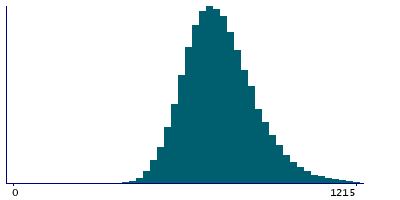
2 Instances
Instance 2 : Imaging visit (2014+)
83,241 participants, 83,241 items
| Maximum | 1911 |
| Decile 9 | 897 |
| Decile 8 | 830 |
| Decile 7 | 785 |
| Decile 6 | 750 |
| Median | 719 |
| Decile 4 | 689 |
| Decile 3 | 658 |
| Decile 2 | 625 |
| Decile 1 | 581 |
| Minimum | 54 |
|

|
- Mean = 731.62
- Std.dev = 129.31
- 284 items above graph maximum of 1213
|
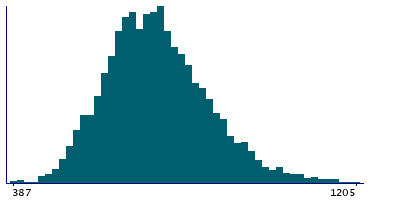
Instance 3 : First repeat imaging visit (2019+)
4,755 participants, 4,755 items
| Maximum | 1433 |
| Decile 9 | 894 |
| Decile 8 | 831 |
| Decile 7 | 786 |
| Decile 6 | 749 |
| Median | 721 |
| Decile 4 | 690 |
| Decile 3 | 661 |
| Decile 2 | 628 |
| Decile 1 | 583 |
| Minimum | 387 |
|
|
- Mean = 732.536
- Std.dev = 128.267
- 19 items above graph maximum of 1205
|
Notes
Area of entorhinal in the left hemisphere generated by parcellation of the pial surface using Desikan-Killiany parcellation
0 Related Data-Fields
There are no related data-fields
0 Resources
There are no matching Resources
