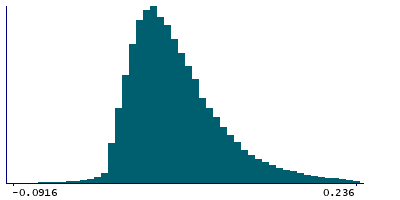
Data
87,996 items of data are available, covering 83,313 participants.
Defined-instances run from 2 to 3, labelled using Instancing
2.
Units of measurement are AU.
| Maximum | 1.4141 |
| Decile 9 | 0.1269 |
| Decile 8 | 0.0971 |
| Decile 7 | 0.0795 |
| Decile 6 | 0.0666 |
| Median | 0.056 |
| Decile 4 | 0.0464 |
| Decile 3 | 0.0376 |
| Decile 2 | 0.0284 |
| Decile 1 | 0.0175 |
| Minimum | -0.3774 |
|
|
- Mean = 0.0665643
- Std.dev = 0.0526396
- 55 items below graph minimum of -0.0919
- 1040 items above graph maximum of 0.2363
|
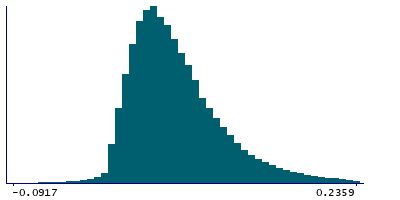
2 Instances
Instance 2 : Imaging visit (2014+)
83,241 participants, 83,241 items
| Maximum | 1.4141 |
| Decile 9 | 0.1268 |
| Decile 8 | 0.097 |
| Decile 7 | 0.0793 |
| Decile 6 | 0.0665 |
| Median | 0.0559 |
| Decile 4 | 0.0463 |
| Decile 3 | 0.0376 |
| Decile 2 | 0.0283 |
| Decile 1 | 0.0174 |
| Minimum | -0.3774 |
|
|
- Mean = 0.066463
- Std.dev = 0.0527127
- 54 items below graph minimum of -0.092
- 989 items above graph maximum of 0.2362
|
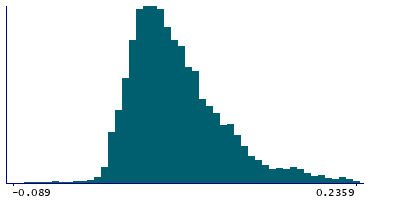
Instance 3 : First repeat imaging visit (2019+)
4,755 participants, 4,755 items
| Maximum | 0.6728 |
| Decile 9 | 0.1276 |
| Decile 8 | 0.1002 |
| Decile 7 | 0.0819 |
| Decile 6 | 0.0689 |
| Median | 0.05785 |
| Decile 4 | 0.0482 |
| Decile 3 | 0.0392 |
| Decile 2 | 0.03 |
| Decile 1 | 0.01935 |
| Minimum | -0.1218 |
|
|
- Mean = 0.0683375
- Std.dev = 0.0513098
- 1 item below graph minimum of -0.0889
- 51 items above graph maximum of 0.23585
|
Notes
Grey-white contrast in unknown in the left hemisphere calculated as a percentage of the mean gray-white matter intensity from Desikan-Killiany parcellation
0 Related Data-Fields
There are no related data-fields
0 Resources
There are no matching Resources
