Data
87,996 items of data are available, covering 83,313 participants.
Defined-instances run from 2 to 3, labelled using Instancing
2.
Units of measurement are AU.
| Maximum | 40.8386 |
| Decile 9 | 26.8147 |
| Decile 8 | 26.0195 |
| Decile 7 | 25.4568 |
| Decile 6 | 24.9746 |
| Median | 24.5268 |
| Decile 4 | 24.0867 |
| Decile 3 | 23.6149 |
| Decile 2 | 23.0716 |
| Decile 1 | 22.3111 |
| Minimum | 14.8062 |
|

|
- Mean = 24.5569
- Std.dev = 1.79161
- 19 items below graph minimum of 17.8075
- 54 items above graph maximum of 31.3182
|
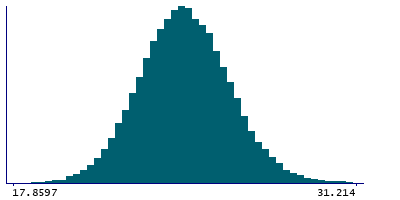
2 Instances
Instance 2 : Imaging visit (2014+)
83,241 participants, 83,241 items
| Maximum | 40.8386 |
| Decile 9 | 26.8126 |
| Decile 8 | 26.0181 |
| Decile 7 | 25.4549 |
| Decile 6 | 24.9742 |
| Median | 24.5267 |
| Decile 4 | 24.0857 |
| Decile 3 | 23.6116 |
| Decile 2 | 23.0673 |
| Decile 1 | 22.3092 |
| Minimum | 14.8062 |
|
|
- Mean = 24.5552
- Std.dev = 1.79311
- 16 items below graph minimum of 17.8058
- 54 items above graph maximum of 31.316
|
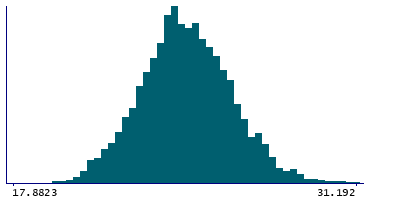
Instance 3 : First repeat imaging visit (2019+)
4,755 participants, 4,755 items
| Maximum | 31.192 |
| Decile 9 | 26.8306 |
| Decile 8 | 26.049 |
| Decile 7 | 25.4823 |
| Decile 6 | 24.9815 |
| Median | 24.5314 |
| Decile 4 | 24.1053 |
| Decile 3 | 23.6794 |
| Decile 2 | 23.1276 |
| Decile 1 | 22.3564 |
| Minimum | 15.1733 |
|
|
- Mean = 24.5868
- Std.dev = 1.76498
- 3 items below graph minimum of 17.8823
|
Notes
Grey-white contrast in cuneus in the left hemisphere calculated as a percentage of the mean gray-white matter intensity from Desikan-Killiany parcellation
0 Related Data-Fields
There are no related data-fields
0 Resources
There are no matching Resources
