Data
87,996 items of data are available, covering 83,313 participants.
Defined-instances run from 2 to 3, labelled using Instancing
2.
Units of measurement are AU.
| Maximum | 38.7165 |
| Decile 9 | 31.6726 |
| Decile 8 | 30.8531 |
| Decile 7 | 30.2633 |
| Decile 6 | 29.7317 |
| Median | 29.2272 |
| Decile 4 | 28.7006 |
| Decile 3 | 28.1029 |
| Decile 2 | 27.3779 |
| Decile 1 | 26.2791 |
| Minimum | 15.7171 |
|

|
- Mean = 29.0773
- Std.dev = 2.15329
- 75 items below graph minimum of 20.8856
- 16 items above graph maximum of 37.066
|
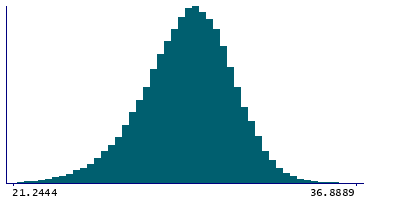
2 Instances
Instance 2 : Imaging visit (2014+)
83,241 participants, 83,241 items
| Maximum | 38.7165 |
| Decile 9 | 31.6465 |
| Decile 8 | 30.83 |
| Decile 7 | 30.2394 |
| Decile 6 | 29.7056 |
| Median | 29.2 |
| Decile 4 | 28.6692 |
| Decile 3 | 28.0765 |
| Decile 2 | 27.346 |
| Decile 1 | 26.2515 |
| Minimum | 15.8167 |
|
|
- Mean = 29.0508
- Std.dev = 2.15446
- 69 items below graph minimum of 20.8565
- 15 items above graph maximum of 37.0414
|
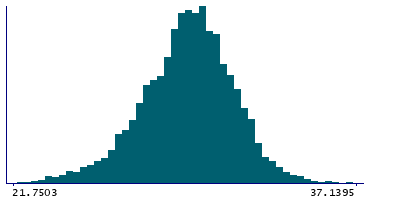
Instance 3 : First repeat imaging visit (2019+)
4,755 participants, 4,755 items
| Maximum | 37.6678 |
| Decile 9 | 32.0098 |
| Decile 8 | 31.2293 |
| Decile 7 | 30.645 |
| Decile 6 | 30.1506 |
| Median | 29.6812 |
| Decile 4 | 29.2035 |
| Decile 3 | 28.6678 |
| Decile 2 | 27.9053 |
| Decile 1 | 26.8801 |
| Minimum | 15.7171 |
|
|
- Mean = 29.5415
- Std.dev = 2.07865
- 7 items below graph minimum of 21.7503
- 1 item above graph maximum of 37.1395
|
Notes
Grey-white contrast in fusiform in the left hemisphere calculated as a percentage of the mean gray-white matter intensity from Desikan-Killiany parcellation
0 Related Data-Fields
There are no related data-fields
0 Resources
There are no matching Resources
