Data
87,996 items of data are available, covering 83,313 participants.
Defined-instances run from 2 to 3, labelled using Instancing
2.
Units of measurement are AU.
| Maximum | 41.4814 |
| Decile 9 | 34.0813 |
| Decile 8 | 33.1925 |
| Decile 7 | 32.5387 |
| Decile 6 | 31.9514 |
| Median | 31.3914 |
| Decile 4 | 30.8178 |
| Decile 3 | 30.1662 |
| Decile 2 | 29.3753 |
| Decile 1 | 28.2039 |
| Minimum | 17.6318 |
|
|
- Mean = 31.2463
- Std.dev = 2.3305
- 55 items below graph minimum of 22.3266
- 6 items above graph maximum of 39.9586
|
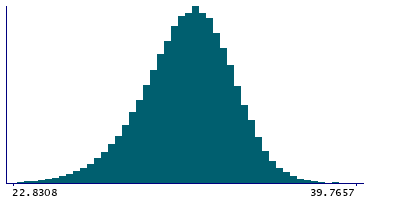
2 Instances
Instance 2 : Imaging visit (2014+)
83,241 participants, 83,241 items
| Maximum | 41.4814 |
| Decile 9 | 34.0561 |
| Decile 8 | 33.1679 |
| Decile 7 | 32.5118 |
| Decile 6 | 31.9224 |
| Median | 31.3616 |
| Decile 4 | 30.7873 |
| Decile 3 | 30.1377 |
| Decile 2 | 29.3469 |
| Decile 1 | 28.1752 |
| Minimum | 18.7189 |
|

|
- Mean = 31.2186
- Std.dev = 2.33134
- 51 items below graph minimum of 22.2944
- 6 items above graph maximum of 39.937
|
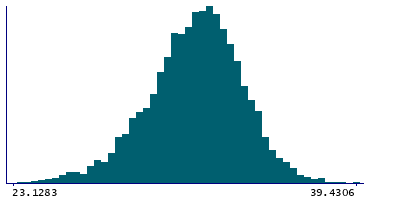
Instance 3 : First repeat imaging visit (2019+)
4,755 participants, 4,755 items
| Maximum | 39.4306 |
| Decile 9 | 34.4517 |
| Decile 8 | 33.5747 |
| Decile 7 | 32.9605 |
| Decile 6 | 32.4211 |
| Median | 31.8896 |
| Decile 4 | 31.3372 |
| Decile 3 | 30.7108 |
| Decile 2 | 29.973 |
| Decile 1 | 28.79 |
| Minimum | 17.6318 |
|
|
- Mean = 31.7307
- Std.dev = 2.26161
- 5 items below graph minimum of 23.1283
|
Notes
Grey-white contrast in inferiortemporal in the left hemisphere calculated as a percentage of the mean gray-white matter intensity from Desikan-Killiany parcellation
0 Related Data-Fields
There are no related data-fields
0 Resources
There are no matching Resources
