Data
87,996 items of data are available, covering 83,313 participants.
Defined-instances run from 2 to 3, labelled using Instancing
2.
Units of measurement are AU.
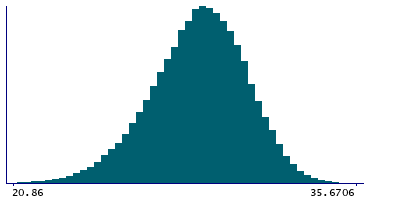
| Maximum | 37.7634 |
| Decile 9 | 31.3201 |
| Decile 8 | 30.5185 |
| Decile 7 | 29.9151 |
| Decile 6 | 29.3797 |
| Median | 28.8633 |
| Decile 4 | 28.3307 |
| Decile 3 | 27.7401 |
| Decile 2 | 27.0029 |
| Decile 1 | 25.9378 |
| Minimum | 17.4705 |
|
|
- Mean = 28.7252
- Std.dev = 2.12246
- 70 items below graph minimum of 20.5554
- 1 item above graph maximum of 36.7025
|
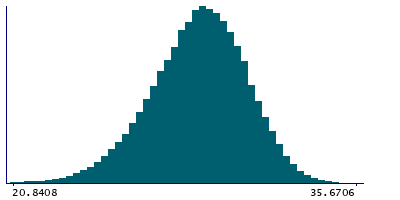
2 Instances
Instance 2 : Imaging visit (2014+)
83,241 participants, 83,241 items
| Maximum | 37.7634 |
| Decile 9 | 31.313 |
| Decile 8 | 30.5093 |
| Decile 7 | 29.903 |
| Decile 6 | 29.3672 |
| Median | 28.8509 |
| Decile 4 | 28.3137 |
| Decile 3 | 27.7207 |
| Decile 2 | 26.9828 |
| Decile 1 | 25.9164 |
| Minimum | 17.4705 |
|
|
- Mean = 28.7113
- Std.dev = 2.12698
- 62 items below graph minimum of 20.5198
- 1 item above graph maximum of 36.7095
|
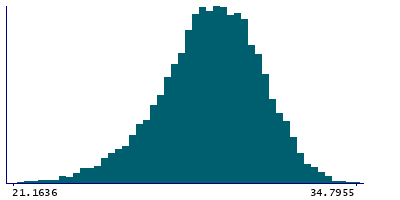
Instance 3 : First repeat imaging visit (2019+)
4,755 participants, 4,755 items
| Maximum | 34.7955 |
| Decile 9 | 31.4326 |
| Decile 8 | 30.6754 |
| Decile 7 | 30.1218 |
| Decile 6 | 29.5991 |
| Median | 29.0988 |
| Decile 4 | 28.603 |
| Decile 3 | 28.0701 |
| Decile 2 | 27.373 |
| Decile 1 | 26.2981 |
| Minimum | 17.8579 |
|
|
- Mean = 28.9685
- Std.dev = 2.02632
- 4 items below graph minimum of 21.1636
|
Notes
Grey-white contrast in lateralorbitofrontal in the left hemisphere calculated as a percentage of the mean gray-white matter intensity from Desikan-Killiany parcellation
0 Related Data-Fields
There are no related data-fields
0 Resources
There are no matching Resources
