Data
87,996 items of data are available, covering 83,313 participants.
Defined-instances run from 2 to 3, labelled using Instancing
2.
Units of measurement are AU.
| Maximum | 40.2706 |
| Decile 9 | 26.2986 |
| Decile 8 | 25.543 |
| Decile 7 | 25.0097 |
| Decile 6 | 24.567 |
| Median | 24.1579 |
| Decile 4 | 23.7439 |
| Decile 3 | 23.3015 |
| Decile 2 | 22.7853 |
| Decile 1 | 22.0622 |
| Minimum | 8.0678 |
|

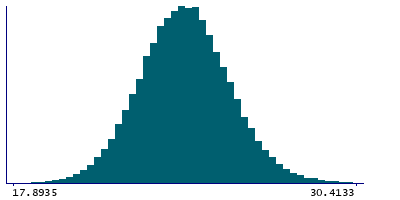
|
- Mean = 24.1735
- Std.dev = 1.689
- 44 items below graph minimum of 17.8258
- 62 items above graph maximum of 30.535
|
2 Instances
Instance 2 : Imaging visit (2014+)
83,241 participants, 83,241 items
| Maximum | 40.2706 |
| Decile 9 | 26.2903 |
| Decile 8 | 25.5346 |
| Decile 7 | 25.0012 |
| Decile 6 | 24.5585 |
| Median | 24.1489 |
| Decile 4 | 23.7349 |
| Decile 3 | 23.2909 |
| Decile 2 | 22.776 |
| Decile 1 | 22.0515 |
| Minimum | 8.0678 |
|
|
- Mean = 24.164
- Std.dev = 1.6905
- 41 items below graph minimum of 17.8128
- 58 items above graph maximum of 30.529
|
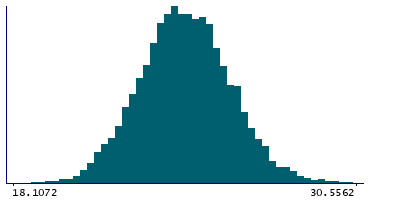
Instance 3 : First repeat imaging visit (2019+)
4,755 participants, 4,755 items
| Maximum | 31.7214 |
| Decile 9 | 26.4065 |
| Decile 8 | 25.7091 |
| Decile 7 | 25.1855 |
| Decile 6 | 24.7533 |
| Median | 24.3145 |
| Decile 4 | 23.9058 |
| Decile 3 | 23.4666 |
| Decile 2 | 22.9708 |
| Decile 1 | 22.2569 |
| Minimum | 16.2457 |
|
|
- Mean = 24.3389
- Std.dev = 1.65386
- 2 items below graph minimum of 18.1072
- 4 items above graph maximum of 30.5562
|
Notes
Grey-white contrast in lingual in the left hemisphere calculated as a percentage of the mean gray-white matter intensity from Desikan-Killiany parcellation
0 Related Data-Fields
There are no related data-fields
0 Resources
There are no matching Resources
