Data
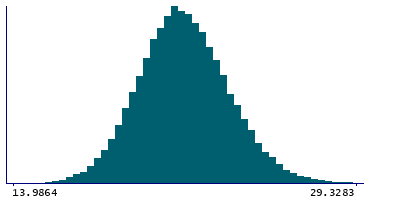
87,996 items of data are available, covering 83,313 participants.
Defined-instances run from 2 to 3, labelled using Instancing
2.
Units of measurement are AU.
| Maximum | 33.5877 |
| Decile 9 | 24.0943 |
| Decile 8 | 23.1726 |
| Decile 7 | 22.5187 |
| Decile 6 | 21.9789 |
| Median | 21.4807 |
| Decile 4 | 20.99 |
| Decile 3 | 20.4723 |
| Decile 2 | 19.8738 |
| Decile 1 | 19.04 |
| Minimum | 13.6445 |
|
|
- Mean = 21.5367
- Std.dev = 1.99198
- 3 items below graph minimum of 13.9857
- 55 items above graph maximum of 29.1486
|
2 Instances
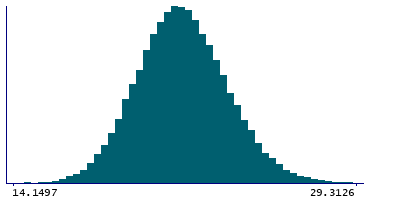
Instance 2 : Imaging visit (2014+)
83,241 participants, 83,241 items
| Maximum | 33.5877 |
| Decile 9 | 24.1146 |
| Decile 8 | 23.1898 |
| Decile 7 | 22.5331 |
| Decile 6 | 21.9862 |
| Median | 21.4856 |
| Decile 4 | 20.9907 |
| Decile 3 | 20.4701 |
| Decile 2 | 19.8694 |
| Decile 1 | 19.0368 |
| Minimum | 13.6445 |
|
|
- Mean = 21.5439
- Std.dev = 2.0014
- 2 items below graph minimum of 13.959
- 50 items above graph maximum of 29.1923
|
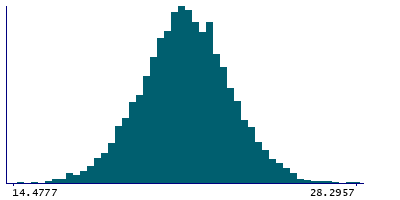
Instance 3 : First repeat imaging visit (2019+)
4,755 participants, 4,755 items
| Maximum | 31.0288 |
| Decile 9 | 23.6897 |
| Decile 8 | 22.8961 |
| Decile 7 | 22.346 |
| Decile 6 | 21.8491 |
| Median | 21.4024 |
| Decile 4 | 20.9803 |
| Decile 3 | 20.4984 |
| Decile 2 | 19.9339 |
| Decile 1 | 19.0841 |
| Minimum | 13.983 |
|
|
- Mean = 21.4093
- Std.dev = 1.81446
- 1 item below graph minimum of 14.4785
- 3 items above graph maximum of 28.2953
|
Notes
Grey-white contrast in paracentral in the left hemisphere calculated as a percentage of the mean gray-white matter intensity from Desikan-Killiany parcellation
0 Related Data-Fields
There are no related data-fields
0 Resources
There are no matching Resources
