Data
87,996 items of data are available, covering 83,313 participants.
Defined-instances run from 2 to 3, labelled using Instancing
2.
Units of measurement are AU.
| Maximum | 31.5024 |
| Decile 9 | 23.1981 |
| Decile 8 | 22.3545 |
| Decile 7 | 21.759 |
| Decile 6 | 21.2574 |
| Median | 20.7892 |
| Decile 4 | 20.3299 |
| Decile 3 | 19.8359 |
| Decile 2 | 19.2638 |
| Decile 1 | 18.4724 |
| Minimum | 12.7935 |
|

|
- Mean = 20.8231
- Std.dev = 1.84896
- 5 items below graph minimum of 13.7467
- 24 items above graph maximum of 27.9238
|
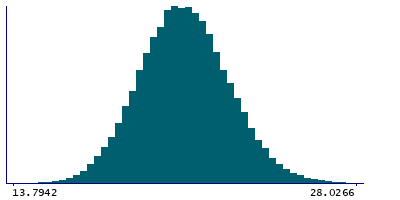
2 Instances
Instance 2 : Imaging visit (2014+)
83,241 participants, 83,241 items
| Maximum | 31.5024 |
| Decile 9 | 23.2182 |
| Decile 8 | 22.369 |
| Decile 7 | 21.7687 |
| Decile 6 | 21.2647 |
| Median | 20.7925 |
| Decile 4 | 20.3321 |
| Decile 3 | 19.8366 |
| Decile 2 | 19.2635 |
| Decile 1 | 18.4711 |
| Minimum | 12.7935 |
|
|
- Mean = 20.8303
- Std.dev = 1.85626
- 4 items below graph minimum of 13.724
- 22 items above graph maximum of 27.9652
|
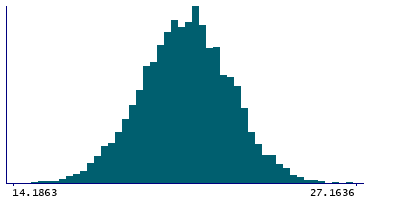
Instance 3 : First repeat imaging visit (2019+)
4,755 participants, 4,755 items
| Maximum | 28.1659 |
| Decile 9 | 22.8378 |
| Decile 8 | 22.1377 |
| Decile 7 | 21.5785 |
| Decile 6 | 21.1373 |
| Median | 20.7272 |
| Decile 4 | 20.2881 |
| Decile 3 | 19.8265 |
| Decile 2 | 19.2688 |
| Decile 1 | 18.5142 |
| Minimum | 13.6621 |
|
|
- Mean = 20.6975
- Std.dev = 1.71122
- 1 item below graph minimum of 14.1905
- 2 items above graph maximum of 27.1615
|
Notes
Grey-white contrast in precentral in the left hemisphere calculated as a percentage of the mean gray-white matter intensity from Desikan-Killiany parcellation
0 Related Data-Fields
There are no related data-fields
0 Resources
There are no matching Resources
