Data
87,996 items of data are available, covering 83,313 participants.
Defined-instances run from 2 to 3, labelled using Instancing
2.
Units of measurement are AU.
| Maximum | 33.0675 |
| Decile 9 | 22.2869 |
| Decile 8 | 21.4166 |
| Decile 7 | 20.8055 |
| Decile 6 | 20.2776 |
| Median | 19.8046 |
| Decile 4 | 19.3316 |
| Decile 3 | 18.8271 |
| Decile 2 | 18.2422 |
| Decile 1 | 17.4376 |
| Minimum | 3.4773 |
|
|
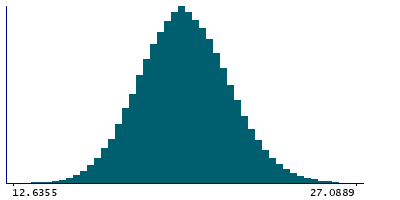
- Mean = 19.8418
- Std.dev = 1.90185
- 4 items below graph minimum of 12.5883
- 37 items above graph maximum of 27.1362
|
2 Instances
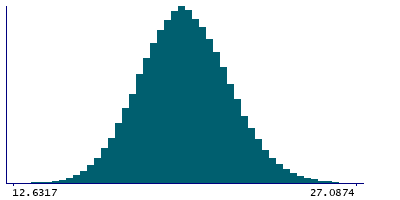
Instance 2 : Imaging visit (2014+)
83,241 participants, 83,241 items
| Maximum | 33.0675 |
| Decile 9 | 22.2869 |
| Decile 8 | 21.4181 |
| Decile 7 | 20.8041 |
| Decile 6 | 20.2751 |
| Median | 19.8032 |
| Decile 4 | 19.3286 |
| Decile 3 | 18.8242 |
| Decile 2 | 18.2391 |
| Decile 1 | 17.435 |
| Minimum | 3.4773 |
|
|
- Mean = 19.8405
- Std.dev = 1.90323
- 3 items below graph minimum of 12.5831
- 35 items above graph maximum of 27.1388
|
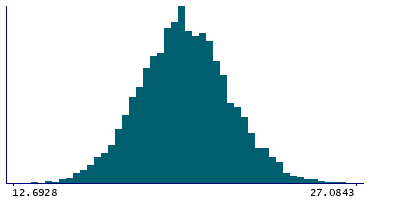
Instance 3 : First repeat imaging visit (2019+)
4,755 participants, 4,755 items
| Maximum | 27.6571 |
| Decile 9 | 22.2871 |
| Decile 8 | 21.3974 |
| Decile 7 | 20.826 |
| Decile 6 | 20.3179 |
| Median | 19.8222 |
| Decile 4 | 19.3827 |
| Decile 3 | 18.8967 |
| Decile 2 | 18.2892 |
| Decile 1 | 17.49 |
| Minimum | 12.4356 |
|
|
- Mean = 19.8633
- Std.dev = 1.87739
- 1 item below graph minimum of 12.6928
- 2 items above graph maximum of 27.0843
|
Notes
Grey-white contrast in transversetemporal in the left hemisphere calculated as a percentage of the mean gray-white matter intensity from Desikan-Killiany parcellation
0 Related Data-Fields
There are no related data-fields
0 Resources
There are no matching Resources
