Data
87,996 items of data are available, covering 83,313 participants.
Defined-instances run from 2 to 3, labelled using Instancing
2.
Units of measurement are AU.
| Maximum | 34.1245 |
| Decile 9 | 25.3169 |
| Decile 8 | 24.5299 |
| Decile 7 | 23.9938 |
| Decile 6 | 23.5317 |
| Median | 23.1113 |
| Decile 4 | 22.6994 |
| Decile 3 | 22.2651 |
| Decile 2 | 21.7475 |
| Decile 1 | 21.0455 |
| Minimum | 13.1515 |
|

|
- Mean = 23.1569
- Std.dev = 1.69715
- 14 items below graph minimum of 16.774
- 74 items above graph maximum of 29.5883
|
2 Instances
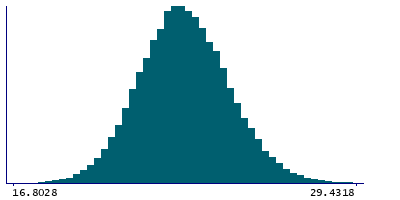
Instance 2 : Imaging visit (2014+)
83,241 participants, 83,241 items
| Maximum | 34.1245 |
| Decile 9 | 25.3174 |
| Decile 8 | 24.5297 |
| Decile 7 | 23.9928 |
| Decile 6 | 23.5318 |
| Median | 23.1103 |
| Decile 4 | 22.6975 |
| Decile 3 | 22.2645 |
| Decile 2 | 21.7472 |
| Decile 1 | 21.0414 |
| Minimum | 15.2949 |
|
|
- Mean = 23.1559
- Std.dev = 1.69886
- 11 items below graph minimum of 16.7654
- 72 items above graph maximum of 29.5934
|
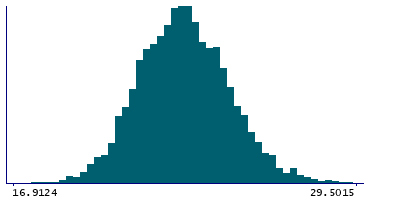
Instance 3 : First repeat imaging visit (2019+)
4,755 participants, 4,755 items
| Maximum | 30.0887 |
| Decile 9 | 25.3051 |
| Decile 8 | 24.5408 |
| Decile 7 | 24.0139 |
| Decile 6 | 23.531 |
| Median | 23.1275 |
| Decile 4 | 22.7248 |
| Decile 3 | 22.2769 |
| Decile 2 | 21.761 |
| Decile 1 | 21.1088 |
| Minimum | 13.1515 |
|
|
- Mean = 23.1742
- Std.dev = 1.66693
- 3 items below graph minimum of 16.9124
- 2 items above graph maximum of 29.5015
|
Notes
Grey-white contrast in cuneus in the right hemisphere calculated as a percentage of the mean gray-white matter intensity from Desikan-Killiany parcellation
0 Related Data-Fields
There are no related data-fields
0 Resources
There are no matching Resources
