Data
87,996 items of data are available, covering 83,313 participants.
Defined-instances run from 2 to 3, labelled using Instancing
2.
Units of measurement are AU.
| Maximum | 39.3702 |
| Decile 9 | 31.9597 |
| Decile 8 | 31.0943 |
| Decile 7 | 30.4528 |
| Decile 6 | 29.8715 |
| Median | 29.3131 |
| Decile 4 | 28.7273 |
| Decile 3 | 28.0653 |
| Decile 2 | 27.2515 |
| Decile 1 | 26.0168 |
| Minimum | 16.9532 |
|

|
- Mean = 29.1288
- Std.dev = 2.3673
- 85 items below graph minimum of 20.0738
- 4 items above graph maximum of 37.9027
|
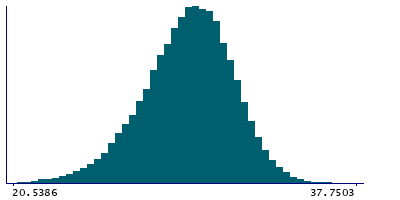
2 Instances
Instance 2 : Imaging visit (2014+)
83,241 participants, 83,241 items
| Maximum | 39.3702 |
| Decile 9 | 31.9335 |
| Decile 8 | 31.0628 |
| Decile 7 | 30.4231 |
| Decile 6 | 29.84 |
| Median | 29.2837 |
| Decile 4 | 28.6947 |
| Decile 3 | 28.0284 |
| Decile 2 | 27.2118 |
| Decile 1 | 25.9812 |
| Minimum | 16.9532 |
|
|
- Mean = 29.0968
- Std.dev = 2.37
- 80 items below graph minimum of 20.0289
- 3 items above graph maximum of 37.8858
|
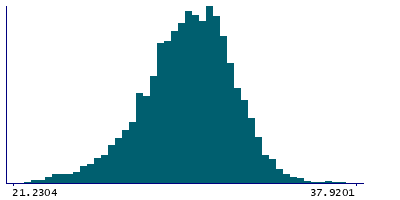
Instance 3 : First repeat imaging visit (2019+)
4,755 participants, 4,755 items
| Maximum | 38.6732 |
| Decile 9 | 32.3569 |
| Decile 8 | 31.5362 |
| Decile 7 | 30.9364 |
| Decile 6 | 30.3958 |
| Median | 29.8532 |
| Decile 4 | 29.2881 |
| Decile 3 | 28.671 |
| Decile 2 | 27.9621 |
| Decile 1 | 26.7936 |
| Minimum | 17.128 |
|
|
- Mean = 29.6879
- Std.dev = 2.24716
- 7 items below graph minimum of 21.2304
- 1 item above graph maximum of 37.9201
|
Notes
Grey-white contrast in inferiortemporal in the right hemisphere calculated as a percentage of the mean gray-white matter intensity from Desikan-Killiany parcellation
0 Related Data-Fields
There are no related data-fields
0 Resources
There are no matching Resources
