Data
87,996 items of data are available, covering 83,313 participants.
Defined-instances run from 2 to 3, labelled using Instancing
2.
Units of measurement are AU.
| Maximum | 33.4069 |
| Decile 9 | 24.7483 |
| Decile 8 | 24.0207 |
| Decile 7 | 23.5194 |
| Decile 6 | 23.0948 |
| Median | 22.7016 |
| Decile 4 | 22.3105 |
| Decile 3 | 21.9002 |
| Decile 2 | 21.4263 |
| Decile 1 | 20.7523 |
| Minimum | 13.051 |
|
|
- Mean = 22.7331
- Std.dev = 1.58923
- 18 items below graph minimum of 16.7562
- 53 items above graph maximum of 28.7444
|
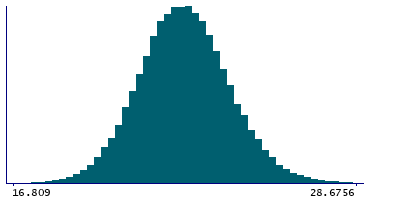
2 Instances
Instance 2 : Imaging visit (2014+)
83,241 participants, 83,241 items
| Maximum | 33.4069 |
| Decile 9 | 24.7401 |
| Decile 8 | 24.0137 |
| Decile 7 | 23.5124 |
| Decile 6 | 23.0885 |
| Median | 22.6938 |
| Decile 4 | 22.302 |
| Decile 3 | 21.8931 |
| Decile 2 | 21.4207 |
| Decile 1 | 20.7422 |
| Minimum | 15.0517 |
|

|
- Mean = 22.7262
- Std.dev = 1.59019
- 14 items below graph minimum of 16.7444
- 51 items above graph maximum of 28.7379
|
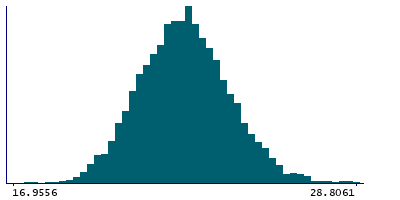
Instance 3 : First repeat imaging visit (2019+)
4,755 participants, 4,755 items
| Maximum | 28.8944 |
| Decile 9 | 24.8559 |
| Decile 8 | 24.1406 |
| Decile 7 | 23.6262 |
| Decile 6 | 23.2041 |
| Median | 22.8402 |
| Decile 4 | 22.4353 |
| Decile 3 | 22.0301 |
| Decile 2 | 21.5318 |
| Decile 1 | 20.9058 |
| Minimum | 13.051 |
|
|
- Mean = 22.8548
- Std.dev = 1.56736
- 4 items below graph minimum of 16.9556
- 1 item above graph maximum of 28.8061
|
Notes
Grey-white contrast in lingual in the right hemisphere calculated as a percentage of the mean gray-white matter intensity from Desikan-Killiany parcellation
0 Related Data-Fields
There are no related data-fields
0 Resources
There are no matching Resources
