Data
87,996 items of data are available, covering 83,313 participants.
Defined-instances run from 2 to 3, labelled using Instancing
2.
Units of measurement are AU.
| Maximum | 31.7361 |
| Decile 9 | 23.9009 |
| Decile 8 | 23.0001 |
| Decile 7 | 22.3753 |
| Decile 6 | 21.8453 |
| Median | 21.3621 |
| Decile 4 | 20.883 |
| Decile 3 | 20.3802 |
| Decile 2 | 19.7937 |
| Decile 1 | 18.9888 |
| Minimum | 4.3615 |
|
|
- Mean = 21.4197
- Std.dev = 1.94279
- 3 items below graph minimum of 14.0768
- 61 items above graph maximum of 28.813
|
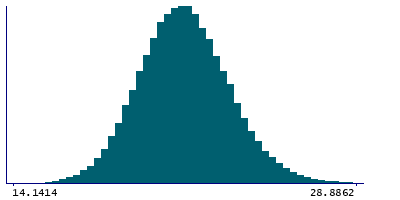
2 Instances
Instance 2 : Imaging visit (2014+)
83,241 participants, 83,241 items
| Maximum | 31.7361 |
| Decile 9 | 23.9277 |
| Decile 8 | 23.0148 |
| Decile 7 | 22.3836 |
| Decile 6 | 21.8506 |
| Median | 21.3653 |
| Decile 4 | 20.8852 |
| Decile 3 | 20.3804 |
| Decile 2 | 19.7936 |
| Decile 1 | 18.9841 |
| Minimum | 4.3615 |
|

|
- Mean = 21.426
- Std.dev = 1.95181
- 3 items below graph minimum of 14.0406
- 59 items above graph maximum of 28.8713
|
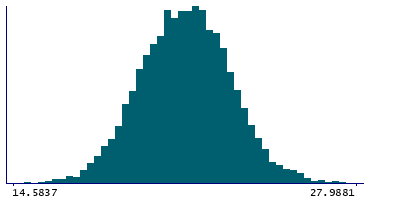
Instance 3 : First repeat imaging visit (2019+)
4,755 participants, 4,755 items
| Maximum | 28.9377 |
| Decile 9 | 23.52 |
| Decile 8 | 22.7836 |
| Decile 7 | 22.239 |
| Decile 6 | 21.7776 |
| Median | 21.3191 |
| Decile 4 | 20.8519 |
| Decile 3 | 20.3796 |
| Decile 2 | 19.7965 |
| Decile 1 | 19.0546 |
| Minimum | 14.3258 |
|
|
- Mean = 21.3081
- Std.dev = 1.77388
- 1 item below graph minimum of 14.5893
- 3 items above graph maximum of 27.9854
|
Notes
Grey-white contrast in paracentral in the right hemisphere calculated as a percentage of the mean gray-white matter intensity from Desikan-Killiany parcellation
0 Related Data-Fields
There are no related data-fields
0 Resources
There are no matching Resources
