Data
87,996 items of data are available, covering 83,313 participants.
Defined-instances run from 2 to 3, labelled using Instancing
2.
Units of measurement are AU.
| Maximum | 35.3869 |
| Decile 9 | 30.1882 |
| Decile 8 | 29.4139 |
| Decile 7 | 28.8268 |
| Decile 6 | 28.3028 |
| Median | 27.8037 |
| Decile 4 | 27.2938 |
| Decile 3 | 26.7067 |
| Decile 2 | 25.995 |
| Decile 1 | 24.9597 |
| Minimum | 14.2542 |
|
|
- Mean = 27.67
- Std.dev = 2.06248
- 60 items below graph minimum of 19.7312
|
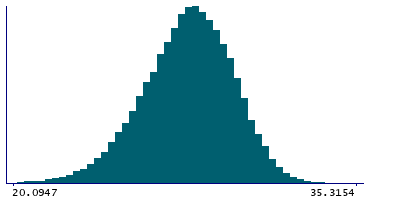
2 Instances
Instance 2 : Imaging visit (2014+)
83,241 participants, 83,241 items
| Maximum | 35.3869 |
| Decile 9 | 30.1808 |
| Decile 8 | 29.4015 |
| Decile 7 | 28.8139 |
| Decile 6 | 28.2862 |
| Median | 27.7865 |
| Decile 4 | 27.2766 |
| Decile 3 | 26.6849 |
| Decile 2 | 25.976 |
| Decile 1 | 24.9367 |
| Minimum | 14.2542 |
|

|
- Mean = 27.6539
- Std.dev = 2.06743
- 55 items below graph minimum of 19.6925
|
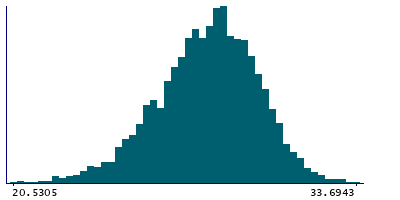
Instance 3 : First repeat imaging visit (2019+)
4,755 participants, 4,755 items
| Maximum | 33.6943 |
| Decile 9 | 30.2956 |
| Decile 8 | 29.597 |
| Decile 7 | 29.0444 |
| Decile 6 | 28.5564 |
| Median | 28.1054 |
| Decile 4 | 27.5903 |
| Decile 3 | 27.0692 |
| Decile 2 | 26.393 |
| Decile 1 | 25.413 |
| Minimum | 16.4744 |
|
|
- Mean = 27.952
- Std.dev = 1.95223
- 5 items below graph minimum of 20.5305
|
Notes
Grey-white contrast in superiortemporal in the right hemisphere calculated as a percentage of the mean gray-white matter intensity from Desikan-Killiany parcellation
0 Related Data-Fields
There are no related data-fields
0 Resources
There are no matching Resources
