Data
87,996 items of data are available, covering 83,313 participants.
Defined-instances run from 2 to 3, labelled using Instancing
2.
Units of measurement are AU.
| Maximum | 34.8263 |
| Decile 9 | 29.746 |
| Decile 8 | 28.945 |
| Decile 7 | 28.3425 |
| Decile 6 | 27.8243 |
| Median | 27.3243 |
| Decile 4 | 26.7998 |
| Decile 3 | 26.2054 |
| Decile 2 | 25.4794 |
| Decile 1 | 24.3957 |
| Minimum | 12.1127 |
|
|
- Mean = 27.1748
- Std.dev = 2.1267
- 73 items below graph minimum of 19.0455
|
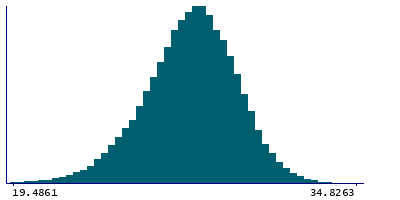
2 Instances
Instance 2 : Imaging visit (2014+)
83,241 participants, 83,241 items
| Maximum | 34.8263 |
| Decile 9 | 29.7572 |
| Decile 8 | 28.9437 |
| Decile 7 | 28.339 |
| Decile 6 | 27.8174 |
| Median | 27.3148 |
| Decile 4 | 26.7878 |
| Decile 3 | 26.1891 |
| Decile 2 | 25.4618 |
| Decile 1 | 24.3752 |
| Minimum | 12.1127 |
|

|
- Mean = 27.1661
- Std.dev = 2.13664
- 68 items below graph minimum of 18.9931
|
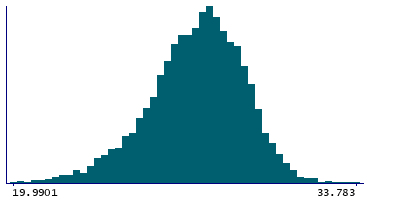
Instance 3 : First repeat imaging visit (2019+)
4,755 participants, 4,755 items
| Maximum | 33.783 |
| Decile 9 | 29.6226 |
| Decile 8 | 28.9684 |
| Decile 7 | 28.4087 |
| Decile 6 | 27.9435 |
| Median | 27.5084 |
| Decile 4 | 26.9972 |
| Decile 3 | 26.4772 |
| Decile 2 | 25.8345 |
| Decile 1 | 24.8063 |
| Minimum | 16.5053 |
|
|
- Mean = 27.3261
- Std.dev = 1.93819
- 5 items below graph minimum of 19.9901
|
Notes
Grey-white contrast in supramarginal in the right hemisphere calculated as a percentage of the mean gray-white matter intensity from Desikan-Killiany parcellation
0 Related Data-Fields
There are no related data-fields
0 Resources
There are no matching Resources
