Data
87,996 items of data are available, covering 83,313 participants.
Defined-instances run from 2 to 3, labelled using Instancing
2.
Units of measurement are AU.
| Maximum | 40.9107 |
| Decile 9 | 32.0833 |
| Decile 8 | 30.9354 |
| Decile 7 | 30.0889 |
| Decile 6 | 29.3364 |
| Median | 28.6088 |
| Decile 4 | 27.8693 |
| Decile 3 | 27.0484 |
| Decile 2 | 26.0294 |
| Decile 1 | 24.5113 |
| Minimum | 5.8923 |
|

|
- Mean = 28.4203
- Std.dev = 3.02005
- 125 items below graph minimum of 16.9393
- 3 items above graph maximum of 39.6554
|
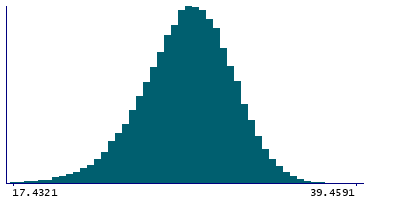
2 Instances
Instance 2 : Imaging visit (2014+)
83,241 participants, 83,241 items
| Maximum | 40.9107 |
| Decile 9 | 32.0596 |
| Decile 8 | 30.9177 |
| Decile 7 | 30.0698 |
| Decile 6 | 29.3154 |
| Median | 28.5883 |
| Decile 4 | 27.8514 |
| Decile 3 | 27.0288 |
| Decile 2 | 26.0112 |
| Decile 1 | 24.4847 |
| Minimum | 5.8923 |
|
|
- Mean = 28.3996
- Std.dev = 3.02395
- 113 items below graph minimum of 16.9097
- 3 items above graph maximum of 39.6346
|
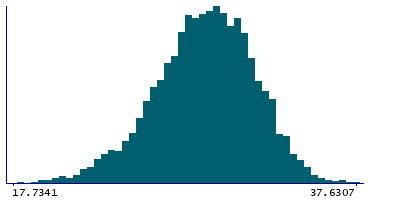
Instance 3 : First repeat imaging visit (2019+)
4,755 participants, 4,755 items
| Maximum | 37.6307 |
| Decile 9 | 32.3784 |
| Decile 8 | 31.2454 |
| Decile 7 | 30.4429 |
| Decile 6 | 29.6852 |
| Median | 28.9534 |
| Decile 4 | 28.2124 |
| Decile 3 | 27.4387 |
| Decile 2 | 26.4555 |
| Decile 1 | 25.0562 |
| Minimum | 14.3459 |
|
|
- Mean = 28.7825
- Std.dev = 2.92734
- 11 items below graph minimum of 17.7341
|
Notes
Grey-white contrast in temporalpole in the right hemisphere calculated as a percentage of the mean gray-white matter intensity from Desikan-Killiany parcellation
0 Related Data-Fields
There are no related data-fields
0 Resources
There are no matching Resources
