Data
87,996 items of data are available, covering 83,313 participants.
Defined-instances run from 2 to 3, labelled using Instancing
2.
Units of measurement are AU.
| Maximum | 31.3286 |
| Decile 9 | 21.245 |
| Decile 8 | 20.3441 |
| Decile 7 | 19.7156 |
| Decile 6 | 19.1863 |
| Median | 18.6943 |
| Decile 4 | 18.2067 |
| Decile 3 | 17.6935 |
| Decile 2 | 17.0822 |
| Decile 1 | 16.2463 |
| Minimum | 10.4719 |
|

|
- Mean = 18.7301
- Std.dev = 1.96185
- 4 items below graph minimum of 11.2477
- 38 items above graph maximum of 26.2436
|
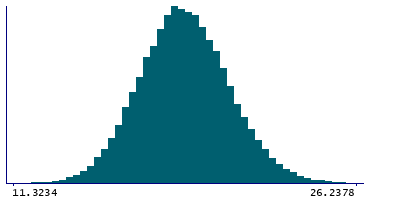
2 Instances
Instance 2 : Imaging visit (2014+)
83,241 participants, 83,241 items
| Maximum | 31.3286 |
| Decile 9 | 21.2422 |
| Decile 8 | 20.3389 |
| Decile 7 | 19.7111 |
| Decile 6 | 19.1814 |
| Median | 18.685 |
| Decile 4 | 18.1987 |
| Decile 3 | 17.6861 |
| Decile 2 | 17.0742 |
| Decile 1 | 16.2395 |
| Minimum | 10.4719 |
|
|
- Mean = 18.7238
- Std.dev = 1.96406
- 4 items below graph minimum of 11.2368
- 36 items above graph maximum of 26.2448
|
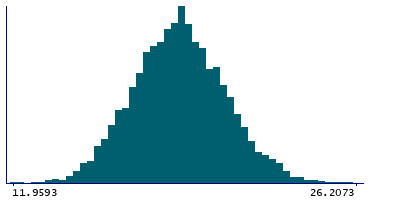
Instance 3 : First repeat imaging visit (2019+)
4,755 participants, 4,755 items
| Maximum | 28.7753 |
| Decile 9 | 21.2901 |
| Decile 8 | 20.4408 |
| Decile 7 | 19.8056 |
| Decile 6 | 19.2712 |
| Median | 18.8283 |
| Decile 4 | 18.3452 |
| Decile 3 | 17.8255 |
| Decile 2 | 17.2245 |
| Decile 1 | 16.3728 |
| Minimum | 11.9593 |
|
|
- Mean = 18.8411
- Std.dev = 1.91935
- 2 items above graph maximum of 26.2073
|
Notes
Grey-white contrast in transversetemporal in the right hemisphere calculated as a percentage of the mean gray-white matter intensity from Desikan-Killiany parcellation
0 Related Data-Fields
There are no related data-fields
0 Resources
There are no matching Resources
