Data
87,996 items of data are available, covering 83,313 participants.
Defined-instances run from 2 to 3, labelled using Instancing
2.
Units of measurement are mm.
| Maximum | 3.292 |
| Decile 9 | 2.63 |
| Decile 8 | 2.535 |
| Decile 7 | 2.465 |
| Decile 6 | 2.406 |
| Median | 2.349 |
| Decile 4 | 2.291 |
| Decile 3 | 2.229 |
| Decile 2 | 2.156 |
| Decile 1 | 2.051 |
| Minimum | 1.041 |
|

|
- Mean = 2.34345
- Std.dev = 0.228821
- 44 items below graph minimum of 1.472
- 6 items above graph maximum of 3.209
|
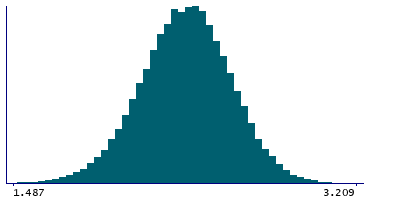
2 Instances
Instance 2 : Imaging visit (2014+)
83,241 participants, 83,241 items
| Maximum | 3.292 |
| Decile 9 | 2.629 |
| Decile 8 | 2.534 |
| Decile 7 | 2.464 |
| Decile 6 | 2.405 |
| Median | 2.348 |
| Decile 4 | 2.29 |
| Decile 3 | 2.228 |
| Decile 2 | 2.155 |
| Decile 1 | 2.05 |
| Minimum | 1.041 |
|
|
- Mean = 2.34239
- Std.dev = 0.228725
- 42 items below graph minimum of 1.471
- 6 items above graph maximum of 3.208
|
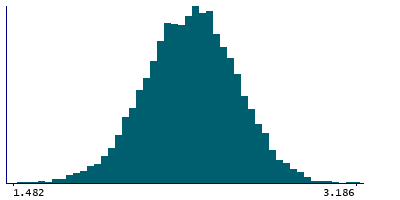
Instance 3 : First repeat imaging visit (2019+)
4,755 participants, 4,755 items
| Maximum | 3.186 |
| Decile 9 | 2.654 |
| Decile 8 | 2.555 |
| Decile 7 | 2.482 |
| Decile 6 | 2.423 |
| Median | 2.367 |
| Decile 4 | 2.308 |
| Decile 3 | 2.244 |
| Decile 2 | 2.172 |
| Decile 1 | 2.068 |
| Minimum | 1.269 |
|
|
- Mean = 2.36203
- Std.dev = 0.229705
- 3 items below graph minimum of 1.482
|
Notes
Mean thickness of BA1 in the left hemisphere generated by parcellation of the white surface using BA_exvivo parcellation
0 Related Data-Fields
There are no related data-fields
0 Resources
There are no matching Resources
