Data
87,996 items of data are available, covering 83,313 participants.
Defined-instances run from 2 to 3, labelled using Instancing
2.
Units of measurement are mm.
| Maximum | 3.679 |
| Decile 9 | 3.111 |
| Decile 8 | 3.002 |
| Decile 7 | 2.921 |
| Decile 6 | 2.847 |
| Median | 2.774 |
| Decile 4 | 2.697 |
| Decile 3 | 2.612 |
| Decile 2 | 2.506 |
| Decile 1 | 2.35 |
| Minimum | 1.25 |
|

|
- Mean = 2.74891
- Std.dev = 0.297421
- 29 items below graph minimum of 1.589
|
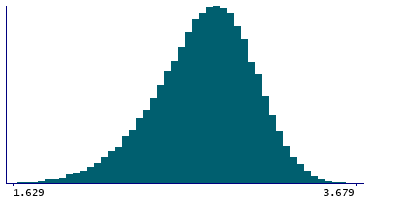
2 Instances
Instance 2 : Imaging visit (2014+)
83,241 participants, 83,241 items
| Maximum | 3.679 |
| Decile 9 | 3.11 |
| Decile 8 | 3.002 |
| Decile 7 | 2.92 |
| Decile 6 | 2.846 |
| Median | 2.773 |
| Decile 4 | 2.696 |
| Decile 3 | 2.61 |
| Decile 2 | 2.503 |
| Decile 1 | 2.348 |
| Minimum | 1.25 |
|
|
- Mean = 2.7476
- Std.dev = 0.297987
- 25 items below graph minimum of 1.586
|
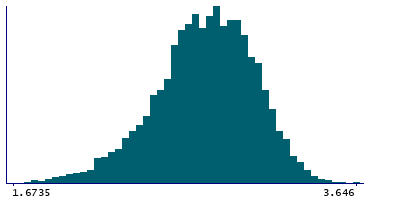
Instance 3 : First repeat imaging visit (2019+)
4,755 participants, 4,755 items
| Maximum | 3.646 |
| Decile 9 | 3.1175 |
| Decile 8 | 3.017 |
| Decile 7 | 2.94 |
| Decile 6 | 2.864 |
| Median | 2.792 |
| Decile 4 | 2.717 |
| Decile 3 | 2.64 |
| Decile 2 | 2.547 |
| Decile 1 | 2.3955 |
| Minimum | 1.49 |
|
|
- Mean = 2.77185
- Std.dev = 0.286371
- 5 items below graph minimum of 1.6735
|
Notes
Mean thickness of BA4a in the right hemisphere generated by parcellation of the white surface using BA_exvivo parcellation
0 Related Data-Fields
There are no related data-fields
0 Resources
There are no matching Resources
