Data
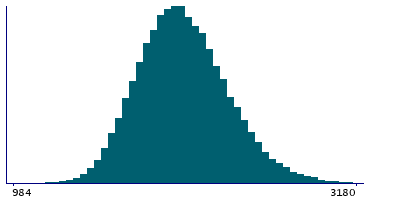
87,996 items of data are available, covering 83,313 participants.
Defined-instances run from 2 to 3, labelled using Instancing
2.
Units of measurement are mm2.
| Maximum | 3691 |
| Decile 9 | 2439.5 |
| Decile 8 | 2297 |
| Decile 7 | 2199 |
| Decile 6 | 2118 |
| Median | 2045 |
| Decile 4 | 1974 |
| Decile 3 | 1901 |
| Decile 2 | 1818 |
| Decile 1 | 1708 |
| Minimum | 626 |
|
|
- Mean = 2062.5
- Std.dev = 287.652
- 8 items below graph minimum of 976.5
- 58 items above graph maximum of 3171
|
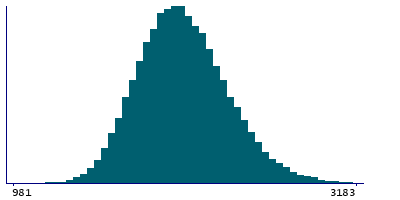
2 Instances
Instance 2 : Imaging visit (2014+)
83,241 participants, 83,241 items
| Maximum | 3691 |
| Decile 9 | 2439 |
| Decile 8 | 2296 |
| Decile 7 | 2198 |
| Decile 6 | 2117 |
| Median | 2044 |
| Decile 4 | 1973 |
| Decile 3 | 1900 |
| Decile 2 | 1817 |
| Decile 1 | 1707 |
| Minimum | 626 |
|
|
- Mean = 2061.57
- Std.dev = 287.945
- 7 items below graph minimum of 975
- 55 items above graph maximum of 3171
|
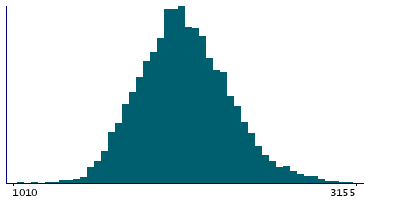
Instance 3 : First repeat imaging visit (2019+)
4,755 participants, 4,755 items
| Maximum | 3350 |
| Decile 9 | 2440 |
| Decile 8 | 2310 |
| Decile 7 | 2213.5 |
| Decile 6 | 2137 |
| Median | 2063.5 |
| Decile 4 | 1999 |
| Decile 3 | 1929 |
| Decile 2 | 1841 |
| Decile 1 | 1725 |
| Minimum | 814 |
|
|
- Mean = 2078.8
- Std.dev = 281.975
- 1 item below graph minimum of 1010
- 3 items above graph maximum of 3155
|
Notes
Area of cuneus in the left hemisphere generated by parcellation of the white surface using DKT parcellation
0 Related Data-Fields
There are no related data-fields
0 Resources
There are no matching Resources
